web analytics

Chosen Stats

Carefully Chosen Sports Stats — Daniel Myers

  • Blog Home
  • Box Plus/Minus
    • ASPM and VORP
    • 2014 ASPM
    • 2013 ASPM
    • 2012 ASPM
    • 2011 ASPM
    • Historical NBA ASPM
    • NCAA ASPM
  • Current Golf Ratings
  • Contact

Google Motion Charts

On Bayesian Predictive Efficiency Rankings

February 15, 2011 by Daniel M 12 Comments
Bayesian Update

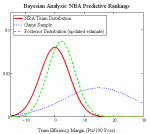
It is fairly easy to construct a retrospective efficiency rating. Take the efficiencies for each game, correct for location and rest, and then solve using an OLS regression for each team’s true efficiency rating. Nice and neat. However, how should a predictive rating work? The best approach would be to adjust for what players are … [Read more…]

Posted in: Google Motion Charts, NBA Adjusted Efficiencies, NBA Rankings, NBA Stats Tagged: Bayesian Analysis, Google Motion Charts, NBA, Projections, Stat Theory, Statistics, Team Ratings

NBA Adjusted Efficiency Rankings 2-6-2011

February 7, 2011 by Daniel M 1 Comment

It’s been a while since I last put together the fully adjusted NBA efficiency rankings. Here are the latest ratings (prev is 1-13-2011, the last time I updated): If you will recall, I last time was puzzling over what exponent to use when minimizing |residuals|^n. I tried out a number of different exponents in out-of-sample … [Read more…]

Posted in: Google Motion Charts, NBA Adjusted Efficiencies, NBA Rankings, NBA Stats Tagged: Google Motion Charts, NBA, Statistics, Team Ratings

Center Comparison Chart (and K-Means Clustering)

January 19, 2011 by Daniel M 8 Comments

Last week, I unveiled a Google Motion Chart that included a large number of advanced stats comparing point guards. This week, we’ll start at the other end: centers. I actually am including players classified as either C or PF/C by BasketballValue, where I got the position information.

Most people feel that the position of center is changing, morphing into something different than it once was. The presence of numerous “centers” that hang around on the perimeter shooting 3’s is an indicator of this phenomenon. Still, there is a defined way a center plays–and to define it, let’s turn to the lovely tool known as K-Means Clustering.

Posted in: Advanced SPM, Google Motion Charts, K-Means Clustering, NBA Stats Tagged: Google Motion Charts, NBA, Player Ratings, Stat Theory, Statistics

NBA Adjusted Efficiency Rankings 1-13-2011

January 14, 2011 by Daniel M 4 Comments

Last week, I unveiled my . This week, I’ll explore some of the decisions I made with that system, per the request of . The first question is how much the ranking are effected by using rest-days adjustments.  See my original research on APBRmetrics for where this comes from.  Here’s a table comparing the effect … [Read more…]

Posted in: Google Motion Charts, NBA Adjusted Efficiencies, NBA Rankings, NBA Stats Tagged: Google Motion Charts, NBA, Statistics, Team Ratings

Point Guard Comparison Chart

January 12, 2011 by Daniel M 6 Comments

So, what else can Google Motion Charts be used to visualize? Well, this application doesn’t actually *move*, but it does visualize a ton of point guard advanced statistics at once. That’s quite a few advanced stats in one place!  Play around with the chart and see what can be revealed.  I have 4 player evaluation … [Read more…]

Posted in: Advanced SPM, Google Motion Charts, NBA Stats Tagged: Google Motion Charts, NBA, Player Ratings, Statistics

NBA Adjusted Efficiencies 1-11-2011

January 11, 2011 by Daniel M 3 Comments

Last week, I unveiled the first iteration of my . This week, I’ll revise and expand on it. The main thing I didn’t like about the chart was the 5-game moving averages. The games dropping off the far end of the moving average add just as much movement as the newest game adds. The solution? … [Read more…]

Posted in: Google Motion Charts, NBA Adjusted Efficiencies, NBA Stats Tagged: Google Motion Charts, NBA, Statistics, Team Ratings

NBA Adjusted Efficiencies 1-4-2011

January 5, 2011 by Daniel M 5 Comments

Hi, I’m Daniel (known as DSMok1 elsewhere), and this will be my first attempt at some fancy Google Visualizations. On my fancy new website.

This viz plots the 5-game TRAILING moving averages for each team in the NBA up through January 4th. It’s a bunch of data; we’ll see if the Google API can handle it.

Posted in: Google Motion Charts, NBA Adjusted Efficiencies, NBA Stats Tagged: Google Motion Charts, NBA, Statistics, Team Ratings
Tweets by @DSMok1

Topics

  • Statistics
  • NBA
  • Team Ratings
  • Player Ratings
  • Bayesian Analysis
  • Stat Theory
  • Visualization
  • Advanced SPM
  • Projections
  • NBA Playoffs
  • Google Motion Charts
  • With-or-Without-You
  • NCAA Basketball
  • Tableau Charts
  • RAPM
  • NCAA Tournament
  • Charts
  • Adjusted +/-
  • Game Prediction
  • VORP
  • Box Score Analysis
  • Trade Analysis
  • NFL Football
  • Hall Rating
  • Hall of Fame
  • Sports History
  • Gallery
  • Salaries
  • NCAA Football
  • Replacement Level

Basketball Stats

  • APBRmetrics Forum
  • Popcorn Machine GameFlows
  • Basketball Reference Blog
  • HoopData
  • Count the Basket

Football Stats

  • Advanced NFL Stats
  • Pro Football Reference
  • Football Outsiders: College

Baseball Stats

  • THE BOOK blog
  • Beyond the Box Score
  • FanGraphs
  • The Hardball Times
  • The Baseball Analysts
  • Sabermetric Research

NBA

  • Daily Thunder
  • Draft Express

Recent Comments

  • AJ on Box Plus/Minus
  • Daniel M on Box Plus/Minus
  • Daniel M on Box Plus/Minus
  • Daniel M on Contact
  • kasra on Contact
  • James H on Box Plus/Minus
  • Leon on Box Plus/Minus
  • Faris Bdair on Box Plus/Minus
  • Daniel M on Box Plus/Minus
  • Faris Bdair on Box Plus/Minus

Copyright © 2025 Chosen Stats.

Alpha WordPress Theme by themehall.com