Note: Advanced Statistical Plus/Minus has been superseded by Box Plus/Minus, which is now available on Basketball Reference.com. Box Plus/Minus is very similar to ASPM, but with improved methodology. The revised and expanded derivation and explanation for Box Plus/Minus, which is based on this writeup here, is located at the About Box Plus/Minus page at Basketball Reference.
Concept of Advanced Statistical Plus/Minus
In order to create a box-score-based player evaluation composite statistic, some basis for the weights given to each statistic must be chosen. A number of different “box-score” stats have been developed over the years; I will not go over them in this space. Some of the more intricate and well known include John Hollinger’s PER (at ESPN), Justin Kubatko’s Win Shares, and Dave Berri’s Wins Produced.
The different composite statistics use a variety of approaches, from pure empirical to pure theory and a mix of the two.
The approach I have followed with Advanced Statistical Plus/Minus (ASPM) leans toward the empirical side, following the concepts of a Statistical Plus/Minus metric. Please read Neil Paine’s review of SPM at Basketball-Reference to understand the background of this approach, originally pioneered by Dan Rosenbaum as a sideline to his Adjusted Plus/Minus (APM) work.
I have differed from earlier public SPM work in a couple of regards:
- Longer-term APM to regress onto (much less random error)
- Ridge-Regressed APM (RAPM) (less random error, slightly more bias)
- Advanced Box Score measures rather than simple points and FGAs (more accurate and less skewed by context)
- Some nonlinear interactions modeled–only what makes sense theoretically, however (more accuracy)
To understand APM and RAPM, the basis for my regression, please read my Review of Adjusted Plus/Minus and Stabilization.
Calculating ASPM
I have published my ASPM Excel Spreadsheet, where all of the calculations are done, online. Feel free to download, play around with it, and follow along.
The basis of my regression is an unweighted, 8 year RAPM kindly created for my use by Jeremias Engelmann, the public-domain leader in the use and calculation of RAPM. This data set includes the seasons from 2003 to 2011. Jeremias used as prior -1.1, weighting that to produce the minimum error in cross-validation within sample. This leads to bias among players with small sample sizes–player rating decreases steadily as the player gets fewer minutes, up until the point where the -1.1 prior starts dominating and bringing the result back toward -1.1.
For this reason, I chose to only use players with more than 3000 possessions over those 8 years–633 players met that criterion and did not have any bugs (like duplicate entries/multiple name variations). For the regression, I weighted by number of possessions played.
For the box-score stats, I used the Team-by-Team Advanced Statistics tables from Basketball-Reference.com.
Over the years, I have composed the regression a number of ways, and have gradually simplified the structure, minimizing terms to minimize over-fitting issues.
The equation, in its current form, looks like this:
a*MPG + b*TRB% + c*BLK% + d*STL% + e*USG%*[TS%*2*(1-TO%) – f*TO% – g + h*AST% + i*USG%]
So, going through this: MPG, TRB%, BLK%, and STL% are all nice, simple, linear terms. They are all context-sensitive, in that they adjust for the number of opportunities a player had.
The scoring term is what is unique about this formulation. Essentially, it is a Usage*(points produced per possession – threshold points produced per possession) term. If a player is above a certain threshold value, any usage helps the team. Below hurts the team.
- TS%*2*(1-TO%) is a points-per-shot term. (USG% is basically shooting possessions plus turnover possessions).
- -f*TO% gives a negative value to turnovers
- -g is the raw threshold value
- +h*AST% gives a positive value to assists. It is certainly counter-intuitive to only include assists within a shooting term, but I have posed this a multitude of ways, and a AST%*USG% term always dominates the regression over any raw AST% terms. This is probably the term I have explored the most in this regression, looking at all possible facets of it.
- +i*USG% gives a (GASP) positive value to shooting more–if the player uses a ton of possessions, they don’t have to be quite as efficient to benefit the team overall.
So–each player’s raw ASPM is calculated through the above equation.
Notice, there wasn’t an intercept in the above equation. That’s added now–the minutes-weighted total of ASPM for the given season is set to 0; all players have the same value added to or subtracted from their total.
Finally, we get to the team/opponent adjustment. We know the team’s efficiency differential, adjusted for strength of schedule. Each team’s ASPM contributions are summed up, the total is compared to the team’s adjusted efficiency differential, and a constant value is added to each player’s ASPM so the team total sums to the team efficiency differential. This adjustment adjusts roughly for things that cannot be captured by ASPM (primarily defense) and also adjusts for strength of schedule.
There you go–each player now has an ASPM value, a measure per 100 possessions played (like the RAPM and Team Efficiency Differential) that approximates what the player’s RAPM would be. This measure is somewhat biased (box scores only capture so much) but is much more stable than RAPM and WAY more stable than APM.
The actual coefficients are as follows:
| Coefficient | Value | Term | Format |
|---|---|---|---|
| a | 0.08033 | MPG | 48.0 |
| b | 0.16984 | TRB% | 100.0 |
| c | 0.27982 | BLK% | 100.0 |
| d | 1.26329 | STL% | 100.0 |
| e | 0.66443 | Scoring | |
| f | 0.53342 | TO% | 1.00 |
| g | 1.47832 | Threshold | |
| h | 0.00794 | AST% | 100.0 |
| i | 0.01160 | USG% | 100.0 |
| TS% | 1.00 |
Just to make things confusing, Basketball-Reference.com reports TS% in the format 0.50 rather than 50.0 like the other terms. Then, I divided TO% (reported in the form 100.0) before using it in the regression. I can’t remember why…
For offense and defense, I simply used the exact same formulation as for ASPM, but removed terms from the other end of the floor. For example, defense only has MPG, DRB%, BLK%, and STL% in its regression.
After calculating OASPM and DASPM, I forced the sum of them to equal ASPM, attributing 81.24% of the difference between OASPM+DASPM and ASPM to error with DASPM (this value was also found by regression).
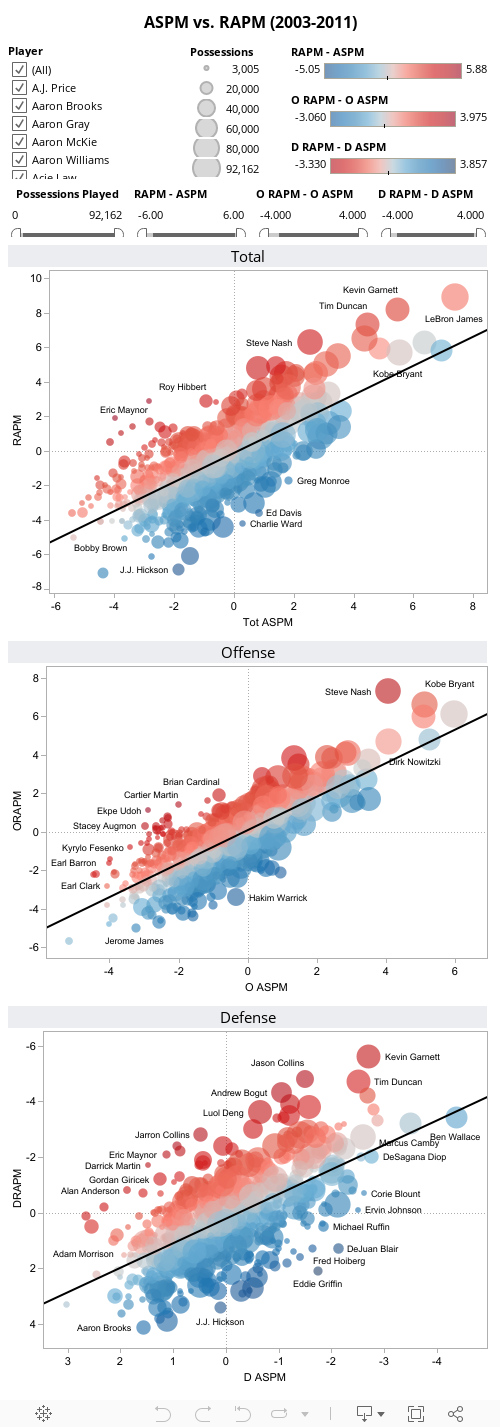
And here are the results in graphical form, for this dataset:
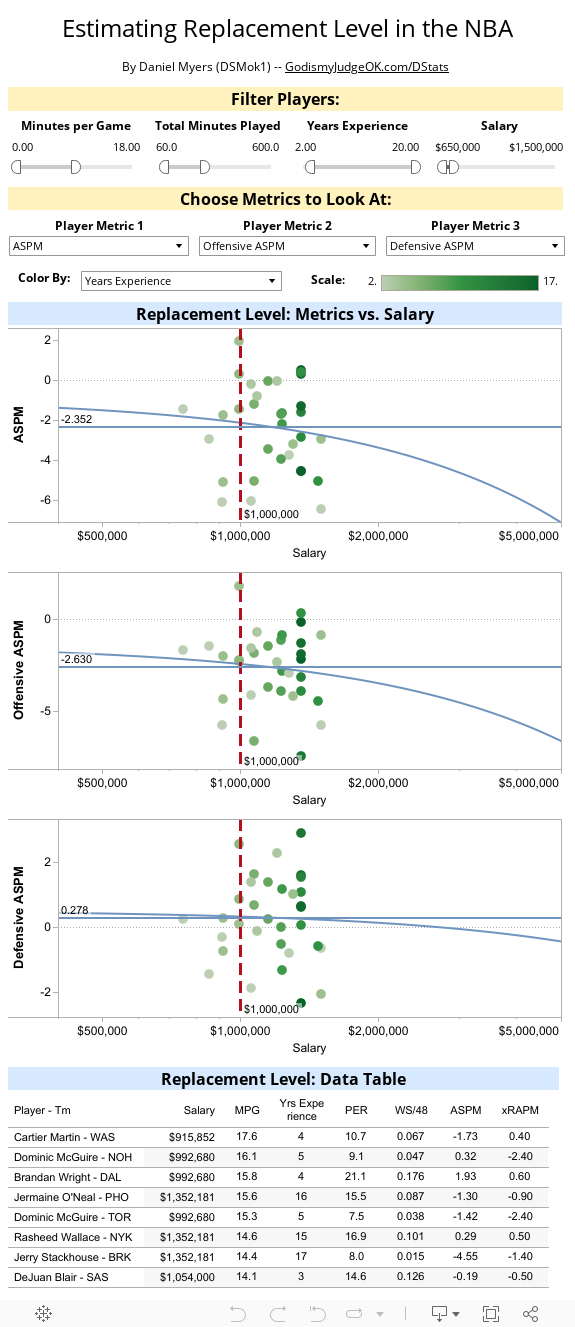
Value over Replacement Player (VORP)
VORP is just calculated as (ASPM + Replacement Player Level)*%min. It’s useful for estimating overall value to the team. The following Tableau viz shows how I have come to the values I used–basically, it is players that would be available for minimum salary. I use -2.35 overall, -2.6 offense, and +0.25 (above average!) for D.
Comparison to Other Stats
Alex at Sports Skeptic compared a bunch of box score metrics on his blog. I recommend reading the whole thing.
I compared some of the other stats to the same 8 year RAPM data set I mentioned above, using weighted correlation. For ASPM, this is in sample, so the results WILL BE INFLATED.
| R^2 Values | |||
|---|---|---|---|
| to RAPM | to O RAPM | to D RAPM | |
| PER | 0.458 | 0.554 | 0.017 |
| Win Shares/48 | 0.531 | ||
| O Win Shares/48 | 0.598 | ||
| D Win Shares/48 | 0.450 | ||
| Wins Produced | 0.380 | 0.217 | 0.142 |
| ASPM | 0.627 | ||
| O ASPM | 0.735 | ||
| D ASPM | 0.492 | ||
Which players have the largest difference in rank between RAPM and ASPM? Love, Collison, and?
Check out these three charts:
http://public.tableausoftware.com/views/ASPMvsRAPM/Total
EDIT: added them in up above.
Of the big names, Garnett, Nash, Duncan, and Deng, and all are underrated by ASPM.
Does the RAPM data set includes all games from all 8 seasons?
Jerry would know that precisely (he did the RAPM work), but the answer is no, not every game. A few games have issues with the PbP. Also, no playoffs were included.
Do you have historical ASPM/VORP numbers? for guys like MJ, Bird, Magic, etc.
Yes, I do: Check out this draft chart, calculated using the previous ASPM version: http://public.tableausoftware.com/views/HistoricalASPM/Year-By-Year
The compiled spreadsheet with the updated ASPM is here: https://docs.google.com/open?id=0Bx1NfCUslJwxM2Q1MzFiMjEtNmY5Mi00ZjgxLWIyOTEtODMzMmM4YmQzMmEx
This is great! Can’t wait to see the historical ASPM back to 1978 once you get that up. What do you think about Simple Ratings? Would you consider using those in any type of metric in conjunction with the ASPM’s?
why is wins produced redacted?
Not redacted. That’s my broken link checker showing the link is dead. The results still stand as shown.