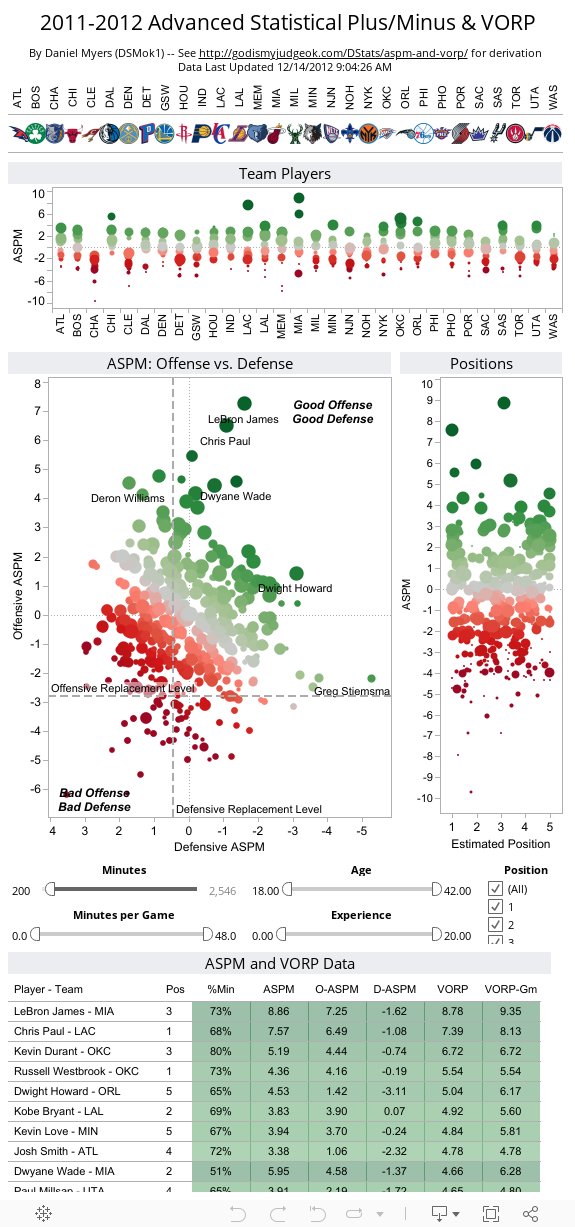
All of the derivation of Advanced Statistical Plus/Minus (ASPM) and Value over Replacement Player (VORP) may be found on my ASPM and VORP page.
To see the full underlying spreadsheet:
All of the derivation of Advanced Statistical Plus/Minus (ASPM) and Value over Replacement Player (VORP) may be found on my ASPM and VORP page.
To see the full underlying spreadsheet:
Pretty neat, but just fyi sorting the table doesn’t work for me.
Working on it
Okay, fixed it. Had to sacrifice conditional formatting.
Cool. One other thing – I don’t see Kobe Bryant???
And Dwight Howard…
Got a bug… I’ll squash it…
Actually, it wasn’t a bug–the maximum value for the MP filter was not automatically setting to the highest value in the database. I just set that filter to be a “minimum” filter rather than a “range” filter to avoid confusion.
Statophile 26 | “Oh My Jonas” and “In Defense of the Ninja” | Raptors Republic | ESPN TrueHoop's Toronto Raptors Blog
[…] Source: godismyjudgeok.com […]
Hello, Daniel. Thank you for responding to my previous questions about ASPM. The following are some suggestions–ideas–on creating a more predictive value metric. I imagine that a lot of these ideas would take an incredibly long time to actually implement, so these are just suggestions for the nebulous future. Some of these ideas may be redundant–i.e. I looked at your list of things to do and it seems like some of these overlap. Also, considering that I’m presenting these ideas as for a predictive measure, you may want to consider them as going to a form of ASPM that would literally be denoted as purely predictive (Future ASPM, FASPM, PASPM?). The list: home court advantage–considered for each team, days of rest (are these what you mean by “temporally-locally weighted rankings”?, distance of travel, age-curves (which I see is on your list–could it be sensitive to height, wingspan, position, mileage? (which would require some defining)), possibly replacing the defensive end of the metric with DRAPM (or finding a way to blend them)(perhaps this defeats the purpose of a box-score stat though), regressing play by play data onto RAPM (I assume you’re using normal box-score data?), strength of schedule (is it possible to measure players at the possession level?) ***I’m sure others can think of a thousand other ways to chew up your time, so that we can all know how our favorite teams will perform. I’ve only recently discovered sports-skeptic, the city2, and your site–I’ve been stuck on wages of wins island. So it follows, I really appreciate your work, and what seems like an effort for transparency on your part, along with a willingness to take the time to politely respond to comments.
Oh, and to make it clear, I wasn’t trying to barb Wages of Wins. To be honest, they’ve for the most part responded to my comments and they also do a good job–I wasn’t trying to create a positive / negative dichotomy.
I certainly agree about the need to create a predictive metric. My thought is to emulate the framework used in baseball analytics: start by explaining what happened/measuring what happened accurately. That is what, I hope, ASPM does.
Then move toward prediction. To create a predictive ASPM model (which I already did for last year, but have not automated the process), basically regress toward a Bayesian prior to obtain a true talent estimate, then apply aging curves to and Bayesian weighting to obtain an estimated true-talent ASPM for year n+1. Fine tune the prior, aging curves, and weighting using the 30+ years of ASPM data I have compiled. The generic aging curve for ASPM is here; it was already calculated some time ago on the APBRmetrics Forum:
ASPM Aging Curve
For the current ASPM, home court advantage is taken care of when summing to each team’s adjusted efficiency differential; this also roughly accounts for strength of opposition. Read the full exposition of ASPM’s theory at http://godismyjudgeok.com/DStats/aspm-and-vorp/ .
Eventually I’d like to create fully-adjusted team efficiencies–adjusting for injuries, playing time, rest days (see my research on them here: http://www.apbr.org/metrics/viewtopic.php?f=2&t=56 ), etc.
Also, eventually, I’d like to create game-by-game ASPM estimates, which I have also done before but not automated.
2012 NBA VORP per Game Vizualization | DStats
[…] 2012 ASPM […]
Why are the values in the table and the excel spreadsheet (when you download it/view it) different? For example, in the table it says Lebron’s VORP is 9.41 but when you view it in the spreadsheet, it says his VORP is 9.60.
One or the other is slightly out of date. Not sure which…
Also, I’m going to be updating to adjust to the new Basketball Team Ratings http://www.basketball-reference.com/leagues/NBA_1986_ratings.html for the years they are available, which is what ASPM is intended to sum to. This data wasn’t available last year.
I’ve also updated my replacement levels (again) based on thinking more about the subject and re-running some numbers. This isn’t reflected here yet, either.
Quora
What are the best statistical methods for analyzing the performance of an NBA player?…
I like this question, but I think it’s sort of like the old joke “Other than that, how was the rest of the play Mrs. Lincoln?” In other words, I’m not a huge fan of stats when it comes to analyzing individual player performance. If you cornered me,…
12 Signs that Kevin Love is the best Power Forward in the NBA | Keeper Of The Court
[…] aspects. It’s no coincidence that publicly available metrics — RAPM, defensive rating, ASPM, defensive win shares — all describe Love as a positive on […]