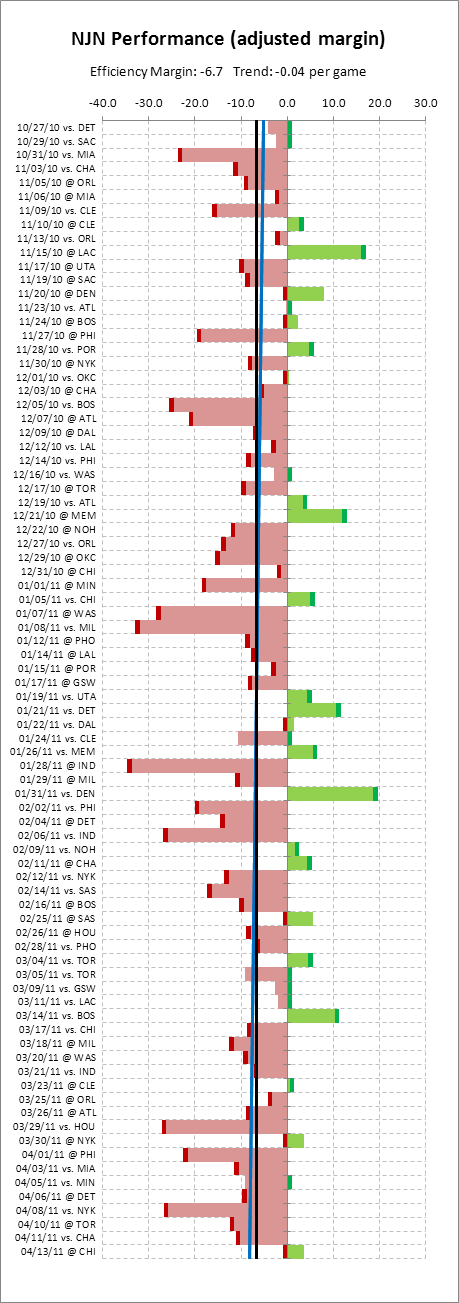
Here are all of the Adjusted Efficiency Team Charts for the 2011 NBA regular season. These are adjusted for opponent (average for their whole season), rest-day-situation, and location.
Here are links to each image (so as to avoid flipping through the slideshow):
- Atlanta Hawks
- Boston Celtics
- Charlotte Bobcats
- Chicago Bulls
- Cleveland Cavaliers
- Dallas Mavericks
- Denver Nuggets
- Detroit Pistons
- Golden State Warriors
- Houston Rockets
- Indiana Pacers
- Los Angeles Clippers
- Los Angeles Lakers
- Memphis Grizzlies
- Miami Heat
- Milwaukee Bucks
- Minnesota Timberwolves
- New Jersey Nets
- New Orleans Hornets
- New York Knickerbockers
- Oklahoma City Thunder
- Orlando Magic
- Philadelphia 76ers
- Phoenix Suns
- Portland Trail Blazers
- Sacramento Kings
- San Antonio Spurs
- Toronto Raptors
- Utah Jazz
- Washington Wizards

Wow, I’m late to some of the updates around here. Just wanted to say thanks for posting these. It’s a thoroughly awesome way to look at the season.
Thanks! I created an Excel spreadsheet that generates these a while back, and finally got around to posting the images.