There have been a ton of NBA Draft Lottery ideas kicking around since the Philadelphia 76ers started their recent tanking odyssey. Recently at FiveThirtyEight, Nate Silver summarized several of the options and put forward his own wins-based proposal.
The idea behind that tweak to the system is to reduce the “value” of any given loss. While that’s a good start, and will reduce game-by-game tanking, it does little to mitigate the value of systematic tanking like the 76ers have practiced. If anything, it may actually incentivize that style of tanking further! Note that every loss has additional “value”, and that the value actually increases as the losses mount.
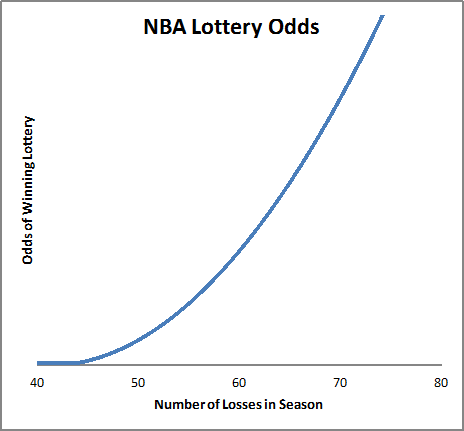
FiveThirtyEight NBA Lottery Odds Model
In the FiveThirtyEight article’s model, note the astronomical chances of winning the lottery that Charlotte had in 2012 after their abysmal 7 win season: almost 40%! That doesn’t feel appropriate.
To improve upon the existing NBA model (which most feel needs some work) and to build on Nate Silver’s model from FiveThirtyEight, let me propose 3 key points for a new methodology:
1. Replace Slot-Based Lottery Odds with Win-Based
This is where Nate Silver’s win-based proposal is great: it reduces odd imbalances in the draft and eliminates the incentive for “throwing games” at the end of the season if tied with another team in the lottery rankings. This year, the 76ers, Timberwolves and Knicks all finished within a couple of games of each other for the worst record. Wouldn’t it make sense if they all received similar lottery odds? Alternatively, if one team was way worse than the next, shouldn’t the odds reflect that? It certainly makes sense.
2. Add Diminishing Returns to the Win-Based Odds
This is the major area I think needed adjustment in Nate Silver’s model. I believe the odds curve should flatten out as the wins mount, rather than accelerating. FiveThirtyEight uses a quadratic equation for the curve.
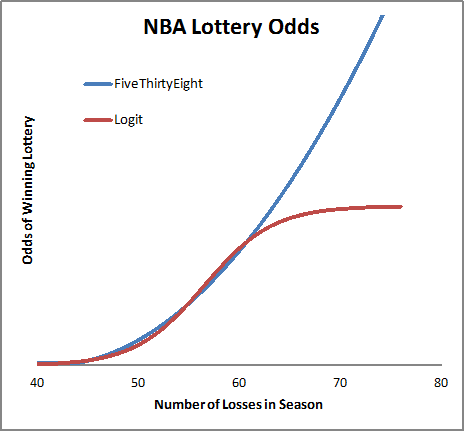
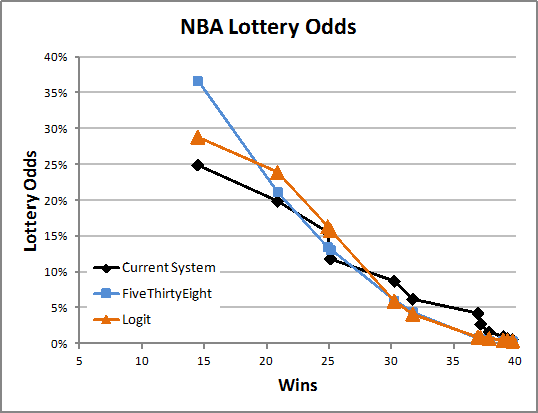
Proposed NBA Lottery Odds compared to FiveThirtyEight model
I’m proposing a logit model. The curve mirrors the FiveThirtyEight model up until a team loses about 62 games (20 wins) and then flattens out steadily. This allows the smooth continuity and advantages of the Win-Based systems, but also reduces the potential benefits from a huge tank job. A team with 7 wins is on about the same footing as a team with 15 or 20 wins.
Let’s look at some examples of how this plays out practically. I built a simulator that spits out realistic season results. Here are some of the graphs:

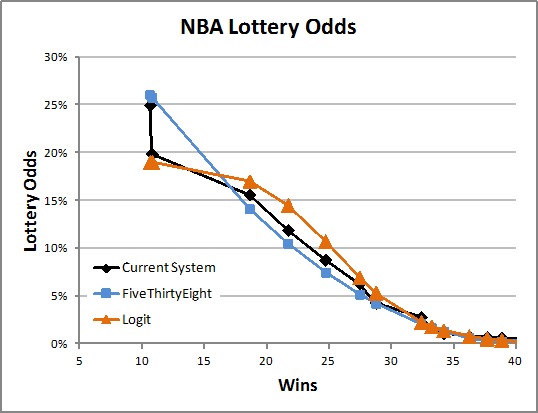
Trial 1
Here is one interesting scenario, illustrating the benefits of a wins-based lottery system. There were 6 teams within 4 wins… and the “best” team in the current system would get only 6% chance of the top pick, while the worst team would get 25%. And they were only 4 or 5 wins apart. Think a little tanking would happen here? Bring on a wins-based system!
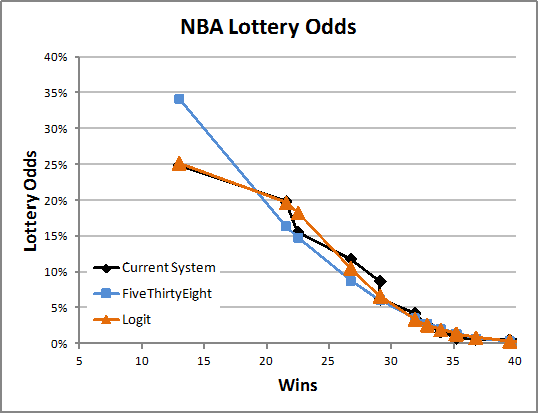
Trial 2
Here’s a scenario similar to the Charlotte situation–one team is way worse than all the others–but the other teams are pretty bad, also. The FiveThirtyEight system gives the worst team huge odds, but my Logit proposal would actually mirror the existing system pretty closely. Don’t want to reward a team that tanks too much!
Trial 3
A common scenario, though a boring one. All 3 systems are pretty similar, though the wins-based systems would still eliminate any selective tanking in the last couple games of the season (notice, the 2nd pick was tightly contested here).
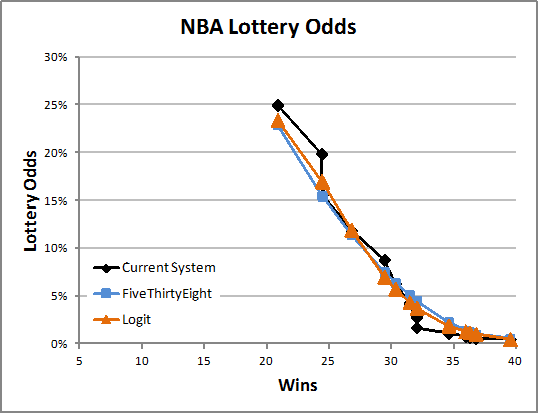
Trial 4
Here’s a scenario where the 3 systems separate more. FiveThirtyEight’s quadratic curve shows clearly, while my Logit tapers off some.
Trial 5
In the current system, the 2 worst teams would be in a tanking war here. Who gets first pick? Who gets second? Meanwhile, the Logit says “Nothing to gain here.” The FiveThirtyEight says “You’re both terrible, here, take all of the odds.”
That’s probably enough examples. The point should be clear: wins-based systems are good and diminishing returns are good.
But I’ve got one more twist could make things even better.
3. Include Prior Years’ Results
If one team just lost LeBron after a great run, and another team has floundered for years–shouldn’t the second team get a bit of a nudge up? I have no idea what weights would work best, but let’s just start out this way: 90% current season 10% last season. It won’t make a huge difference, but just a little nudge up for the team with a bad history. Also, it would break ties nicely!
So in summation: keep the lottery for the top 3 picks, and continue to slot based on (adjusted) record thereafter. However, make the odds based on wins and use diminishing returns, and adjust records to give some weight to prior years.
That should solve most of the tanking ills.
Footnotes:
- The actual Logit function that I used is rather messy, but is defined as follows:
Losses “Lottery Chances” 41 1 49 10 64 90 72 99 Those 4 points describe a Logit curve.
- The Excel Spreadsheet where I did all of these calculations is located at https://drive.google.com/file/d/0Bx1NfCUslJwxeUxFN09UWkxMTDg/view?usp=sharing