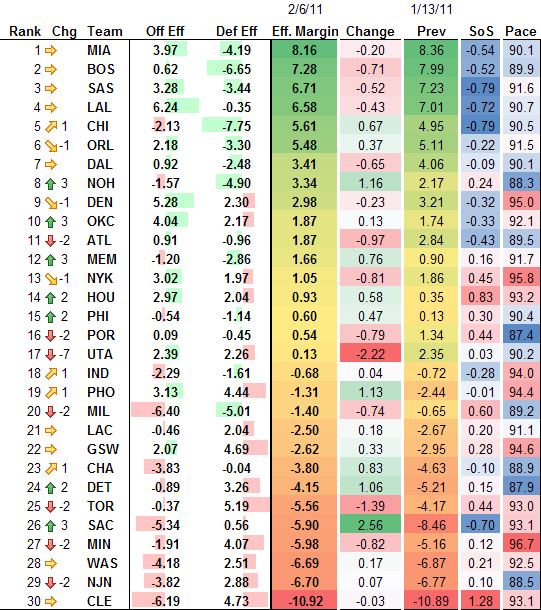
It’s been a while since I last put together the fully adjusted NBA efficiency rankings. Here are the latest ratings (prev is 1-13-2011, the last time I updated):
| Rank | Chg | Team | Off Eff | Def Eff | Eff. Margin | Change | Prev | SoS | Pace |
|---|---|---|---|---|---|---|---|---|---|
| 1 | MIA | 3.97 | -4.19 | 8.16 | -0.20 | 8.36 | -0.54 | 90.1 | |
| 2 | BOS | 0.62 | -6.65 | 7.28 | -0.71 | 7.99 | -0.52 | 89.9 | |
| 3 | SAS | 3.28 | -3.44 | 6.71 | -0.52 | 7.23 | -0.79 | 91.6 | |
| 4 | LAL | 6.24 | -0.35 | 6.58 | -0.43 | 7.01 | -0.72 | 90.7 | |
| 5 | 1 | CHI | -2.13 | -7.75 | 5.61 | 0.67 | 4.95 | -0.79 | 90.5 |
| 6 | -1 | ORL | 2.18 | -3.30 | 5.48 | 0.37 | 5.11 | -0.22 | 91.5 |
| 7 | DAL | 0.92 | -2.48 | 3.41 | -0.65 | 4.06 | -0.09 | 90.1 | |
| 8 | 3 | NOH | -1.57 | -4.90 | 3.34 | 1.16 | 2.17 | 0.24 | 88.3 |
| 9 | -1 | DEN | 5.28 | 2.30 | 2.98 | -0.23 | 3.21 | -0.32 | 95.0 |
| 10 | 3 | OKC | 4.04 | 2.17 | 1.87 | 0.13 | 1.74 | -0.33 | 92.1 |
| 11 | -2 | ATL | 0.91 | -0.96 | 1.87 | -0.97 | 2.84 | -0.43 | 89.5 |
| 12 | 3 | MEM | -1.20 | -2.86 | 1.66 | 0.76 | 0.90 | 0.16 | 91.7 |
| 13 | -1 | NYK | 3.02 | 1.97 | 1.05 | -0.81 | 1.86 | 0.45 | 95.8 |
| 14 | 2 | HOU | 2.97 | 2.04 | 0.93 | 0.58 | 0.35 | 0.83 | 93.2 |
| 15 | 2 | PHI | -0.54 | -1.14 | 0.60 | 0.47 | 0.13 | 0.30 | 90.4 |
| 16 | -2 | POR | 0.09 | -0.45 | 0.54 | -0.79 | 1.34 | 0.44 | 87.4 |
| 17 | -7 | UTA | 2.39 | 2.26 | 0.13 | -2.22 | 2.35 | 0.03 | 90.2 |
| 18 | 1 | IND | -2.29 | -1.61 | -0.68 | 0.04 | -0.72 | -0.28 | 94.0 |
| 19 | 1 | PHO | 3.13 | 4.44 | -1.31 | 1.13 | -2.44 | -0.01 | 94.4 |
| 20 | -2 | MIL | -6.40 | -5.01 | -1.40 | -0.74 | -0.65 | 0.60 | 89.2 |
| 21 | LAC | -0.46 | 2.04 | -2.50 | 0.18 | -2.67 | 0.20 | 91.1 | |
| 22 | GSW | 2.07 | 4.69 | -2.62 | 0.33 | -2.95 | 0.28 | 94.6 | |
| 23 | 1 | CHA | -3.83 | -0.04 | -3.80 | 0.83 | -4.63 | -0.10 | 88.9 |
| 24 | 2 | DET | -0.89 | 3.26 | -4.15 | 1.06 | -5.21 | 0.15 | 87.9 |
| 25 | -2 | TOR | -0.37 | 5.19 | -5.56 | -1.39 | -4.17 | 0.44 | 93.0 |
| 26 | 3 | SAC | -5.34 | 0.56 | -5.90 | 2.56 | -8.46 | -0.70 | 93.1 |
| 27 | -2 | MIN | -1.91 | 4.07 | -5.98 | -0.82 | -5.16 | 0.12 | 96.7 |
| 28 | WAS | -4.18 | 2.51 | -6.69 | 0.17 | -6.87 | 0.21 | 92.5 | |
| 29 | -2 | NJN | -3.82 | 2.88 | -6.70 | 0.07 | -6.77 | 0.10 | 88.5 |
| 30 | CLE | -6.19 | 4.73 | -10.92 | -0.03 | -10.89 | 1.28 | 93.1 |
If you will recall, I last time was puzzling over what exponent to use when minimizing |residuals|^n. I tried out a number of different exponents in out-of-sample tests (for example, 2/3 of games in sample, compared to 1/3 of games out of sample) and discovered a few things. First, there is a ton of random scatter as to which exponent produced the closest results in the out-of-sample test (exponents as small as 1.3 and as large as 2.5 were best, depending on how the samples were split). Secondly, the only reason to use an exponent other than 2 would be if we are certain team performances ARE skewed distributions. Third… I think team performances probably approximate a random sample from a normal distribution–thus, I am switching to minimizing squared error.
How about the same rankings as a lovely image?
Interesting notes:
- Utah is playing badly
- Chicago is dangerous, and they aren’t even healthy yet
- Did anyone think OKC would have the 3rd best offense?
- The Hornets have been seriously up-and-down
- Has anyone mentioned that Cleveland is bad?
As another improvement, I created a macro that went through and calculated the team ratings, offensive ratings, defensive ratings, and pace numbers after each day of the season. Thus, the latest Google Motion Chart now has all 4 data points for each day of the season since December 1st (the ratings are really unstable early in the season).
Watch how Chicago, Utah, and Cleveland have changed since that date!
The full data for this visualization is available as a Google Spreadsheet.

The change column is helpful.