The concept of With-or-Without-You is very basic. If you are playing, is our team better or worse? If the team is worse with you available, then that’s a really bad sign! It’s the core concept behind such basketball metrics as +/-, Statistical Plus/Minus and Advanced Plus/Minus. In baseball, Tom Tango and MGL work with it a lot.
At its basic level, however, we can just look at games when a player was hurt or otherwise out. How did the team fare? With starting PF Jeff Green out, do the Thunder collapse? How about key backup PF/C Nick Collison? As a Thunder fan, I have followed the dialogue amongst the fans as they ponder the defense and the role of the post players. (Mostly on DailyThunder.com–good job, Royce & Co.!)
Yesterday, Hickory High took a look at what Nick Collison is doing. I’m going to look at this subject again, and expand to include all of the key Oklahoma City Thunder players that have missed time.
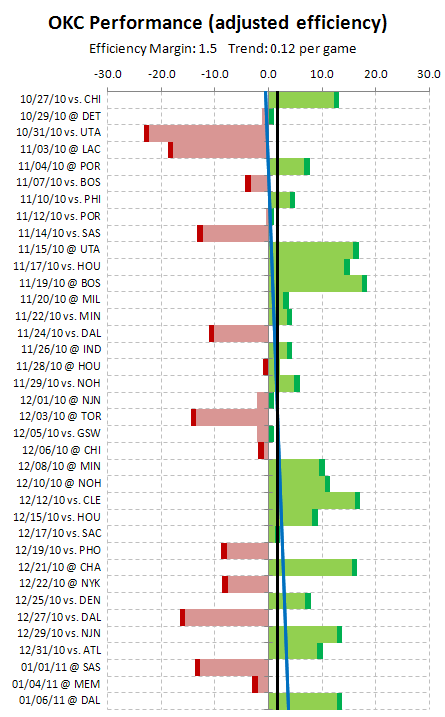
First of all, I’ll bring in OKC’s team chart, to illustrate how their season has gone. Again, these team charts are adjusted for opponent, rest days, and location, to provide a clear view of how well the team played compared to NBA average.
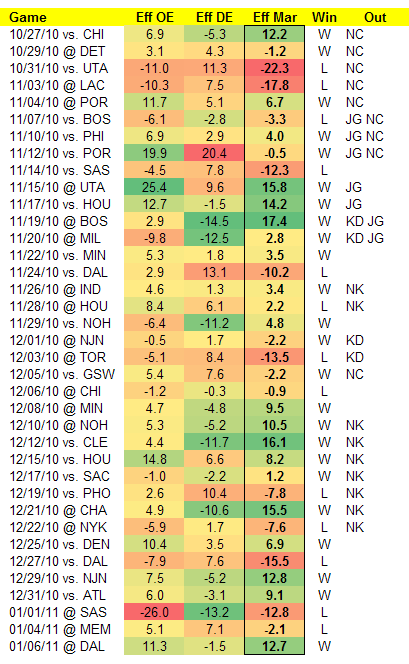
Next, let’s see who was missing for each game, and how the team did on offense, defense, and overall. The data will be in a table at the end of this post for copying.
So what do we see? Well, OKC’s defense was worse with Nick Collison out. OKC played well with Jeff Green missing, and with Nenad Krstic missing. And their offense is bad without KD.
To further isolate the effects, I ran a regression to predict how well the team would play on offense, defense, and overall, based on who was playing in the game and who was not. The results are pretty impressive:
| Player | Point Differential | Offense | Defense |
|---|---|---|---|
| Kevin Durant | 5.3 | 9.5 | 4.2 |
| Jeff Green | -10.9 | -9.1 | 1.7 |
| Nenad Krstic | -3.7 | -2.4 | 1.3 |
| Nick Collison | 7.3 | 1.9 | -5.4 |
First: negative is good for defense; positive is good for offense and overall.
Next: Wow! Collison can play some D! And… Jeff Green hasn’t been very good. He seems to kill the offense (probably because of his 52% TS%, 4.3% ORB%, and 8.7% AST%, all of which are rather low). Kevin Durant seems to kill the defense, but he sure can light a fire under the offense!
Of course, this is a very small sample size, but it does serve to highlight the very things OKC fans have been noticing this year: Nick has been very valuable, in fact the most valuable of the 4 players who have missed games. And yes, OKC fans, the Thunder has played better with both Jeff Green and Nenad Krstic out. (That would imply that more minutes for Serge Ibaka would be a good thing, no?)
Overall, OKC with everyone playing has been about +1, or 1 point above average per 100 possessions. That’s rather mediocre; about a 44-win team. However, OKC has played to the level of their competition quite a bit, so they have won more games than one would expect. It appears that the team has quite a bit of upside to exploit, with changes to player roles and rotations a prime area to look at.
As promised, the data table in copyable form:
| Gm | Game | Adj OE | Adj DE | Adj Eff Mar | Win | Out |
|---|---|---|---|---|---|---|
| 1 | 10/27/10 vs. CHI | 6.9 | -5.3 | 12.2 | W | NC |
| 2 | 10/29/10 @ DET | 3.1 | 4.3 | -1.2 | W | NC |
| 3 | 10/31/10 vs. UTA | -11.0 | 11.3 | -22.3 | L | NC |
| 4 | 11/03/10 @ LAC | -10.3 | 7.5 | -17.8 | L | NC |
| 5 | 11/04/10 @ POR | 11.7 | 5.1 | 6.7 | W | NC |
| 6 | 11/07/10 vs. BOS | -6.1 | -2.8 | -3.3 | L | JG NC |
| 7 | 11/10/10 vs. PHI | 6.9 | 2.9 | 4.0 | W | JG NC |
| 8 | 11/12/10 vs. POR | 19.9 | 20.4 | -0.5 | W | JG NC |
| 9 | 11/14/10 vs. SAS | -4.5 | 7.8 | -12.3 | L | |
| 10 | 11/15/10 @ UTA | 25.4 | 9.6 | 15.8 | W | JG |
| 11 | 11/17/10 vs. HOU | 12.7 | -1.5 | 14.2 | W | JG |
| 12 | 11/19/10 @ BOS | 2.9 | -14.5 | 17.4 | W | KD JG |
| 13 | 11/20/10 @ MIL | -9.8 | -12.5 | 2.8 | W | KD JG |
| 14 | 11/22/10 vs. MIN | 5.3 | 1.8 | 3.5 | W | |
| 15 | 11/24/10 vs. DAL | 2.9 | 13.1 | -10.2 | L | |
| 16 | 11/26/10 @ IND | 4.6 | 1.3 | 3.4 | W | NK |
| 17 | 11/28/10 @ HOU | 8.4 | 6.1 | 2.2 | L | NK |
| 18 | 11/29/10 vs. NOH | -6.4 | -11.2 | 4.8 | W | |
| 19 | 12/01/10 @ NJN | -0.5 | 1.7 | -2.2 | W | KD |
| 20 | 12/03/10 @ TOR | -5.1 | 8.4 | -13.5 | L | KD |
| 21 | 12/05/10 vs. GSW | 5.4 | 7.6 | -2.2 | W | NC |
| 22 | 12/06/10 @ CHI | -1.2 | -0.3 | -0.9 | L | |
| 23 | 12/08/10 @ MIN | 4.7 | -4.8 | 9.5 | W | |
| 24 | 12/10/10 @ NOH | 5.3 | -5.2 | 10.5 | W | NK |
| 25 | 12/12/10 vs. CLE | 4.4 | -11.7 | 16.1 | W | NK |
| 26 | 12/15/10 vs. HOU | 14.8 | 6.6 | 8.2 | W | NK |
| 27 | 12/17/10 vs. SAC | -1.0 | -2.2 | 1.2 | W | NK |
| 28 | 12/19/10 vs. PHO | 2.6 | 10.4 | -7.8 | L | NK |
| 29 | 12/21/10 @ CHA | 4.9 | -10.6 | 15.5 | W | NK |
| 30 | 12/22/10 @ NYK | -5.9 | 1.7 | -7.6 | L | NK |
| 31 | 12/25/10 vs. DEN | 10.4 | 3.5 | 6.9 | W | |
| 32 | 12/27/10 vs. DAL | -7.9 | 7.6 | -15.5 | L | |
| 33 | 12/29/10 vs. NJN | 7.5 | -5.2 | 12.8 | W | |
| 34 | 12/31/10 vs. ATL | 6.0 | -3.1 | 9.1 | W | |
| 35 | 01/01/11 @ SAS | -26.0 | -13.2 | -12.8 | L | |
| 36 | 01/04/11 @ MEM | 5.1 | 7.1 | -2.1 | L | |
| 37 | 01/06/11 @ DAL | 11.3 | -1.5 | 12.7 | W |


Cool beans, DSMok1! Thanks for the work, and thanks especially for the new blog.
Thanks, Sammy!
Is your regression essentially Adjusted +/- at game level instead of play level? There obviously is going to be some loss of precision going from play level tracking of impact to game level summary.
Did you adjust for overall season level quality of team faced or not? (Also adjusting for who is out for the opponents would be a possible refinement, if not already done.)
I think there is some merit to this type of effort. I had previously talked years ago about some type of team specific re-runs of Adjusted +/- to try to optimize within team ratings more than that achieved by a broad league level rating effort of all players within and between teams.
I started with the completely adjusted game efficiencies–adjusted for opponent, rest, and location. So yes, this is fully adjusted for opponent.
Then, I just looked at how good the team did with or without the player. OKC was 7.3 points per 100 possessions better with Nick Collison available.
So this isn’t Adjusted +/-. This is more analogous to VORP, because it’s not per possession, but rather gives a point value to overall value to the team, per team possession. It’s also not relative to league average. It’s just “With or Without You”.
Sure, granularity is given up. But since the goal is the team level impact, anyway, we gain by not having to translate from individual impact to team impact.