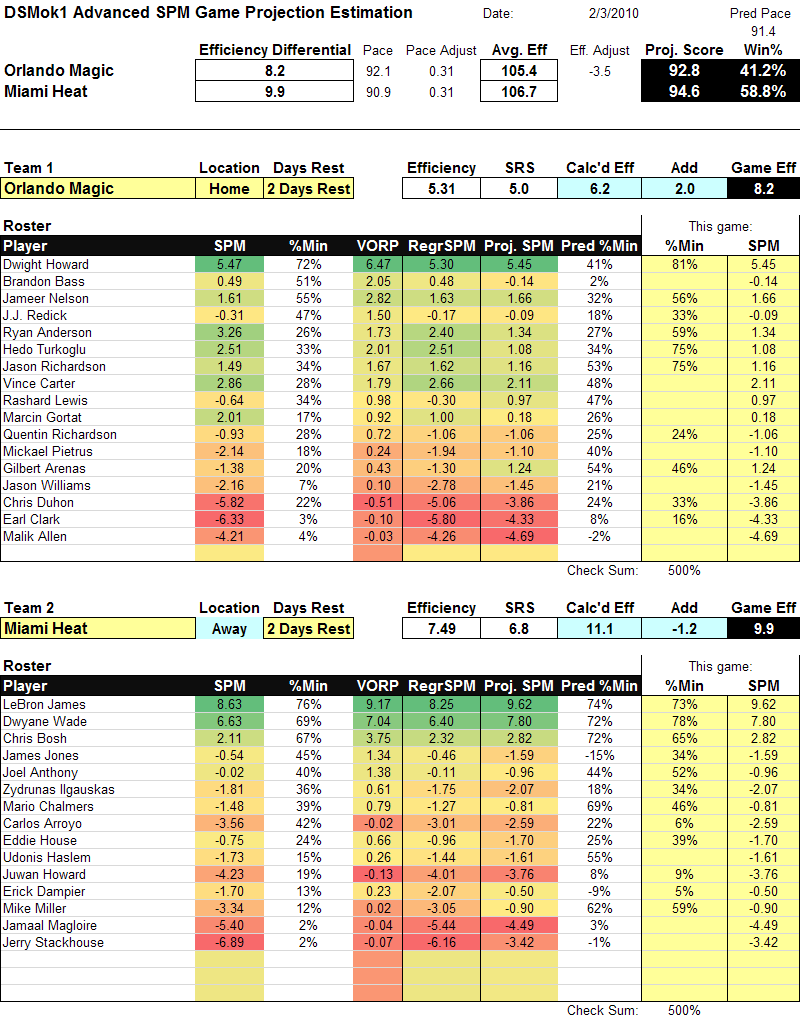
The ASPM spreadsheet (download here) has a sheet for estimating a game’s results, based on team rest, location, and the rotation of players expected to play. For a quick example, I’ll look at the Magic vs. Heat game this evening. Here’s the sheet:
I estimated the minutes each player would play based upon the rotations of the last 5 games for each team. Redick is probable and Bass is out for the Magic; Haslem is of course out for the Heat. I used the Bayesian best estimate for the current true-talent ASPM as the projected plus/minus for each player. That hurts Anderson and Turkoglu (both have been playing really well recently). The Heat have tightened up their rotation recently (as I mentioned in my recap of the OKC-MIA game); they’ve basically dropped Arroyo from the lineup, which is good for them.
The resulting estimate has Orlando at a +6.2 efficiency differential and Miami at a +11.1. However, Orlando is at home. Both teams have the same rest situation. The result: Miami as a +9.9, Orlando as a +8.2 (compared to a league-average team with a league-average rest situation on a neutral floor.) The projected score is 94.6 to 92.8, or I’ll call it 95 to 93. Miami has a 59% chance of winning.

Excellent work, thanks! Am playing around with this, wondering how you get the projected scores and the projected win%. I don’t understand what the 0.936 and 6.394 are or come from to be factored into the projected score.
Then, you run a Normal Distribution on the efficiency differentials, plus a term derived from those numbers, divided by 9. I don’t understand why either.
Would appreciate any comments, thanks so much.