Yesterday’s Thunder-Heat game was a fun game to watch and a great game to investigate.
Oklahoma City started out with a significant advantage in this game: OKC was at home (worth 3.24 pts/100 poss) and was playing on 1 day of rest (+1.94), while Miami was playing their 3rd game in 4 days, and on the second night of a back-to-back (-1.01). Thus, OKC had a 6.19 pt advantage based on the home court and rest conditions. Of course, Miami is the best team in the league, with a +7.55 efficiency margin on average–and that includes games with players injured, most of whom were back for this game.
Before I go any further, here’s the link to the box score for this game.
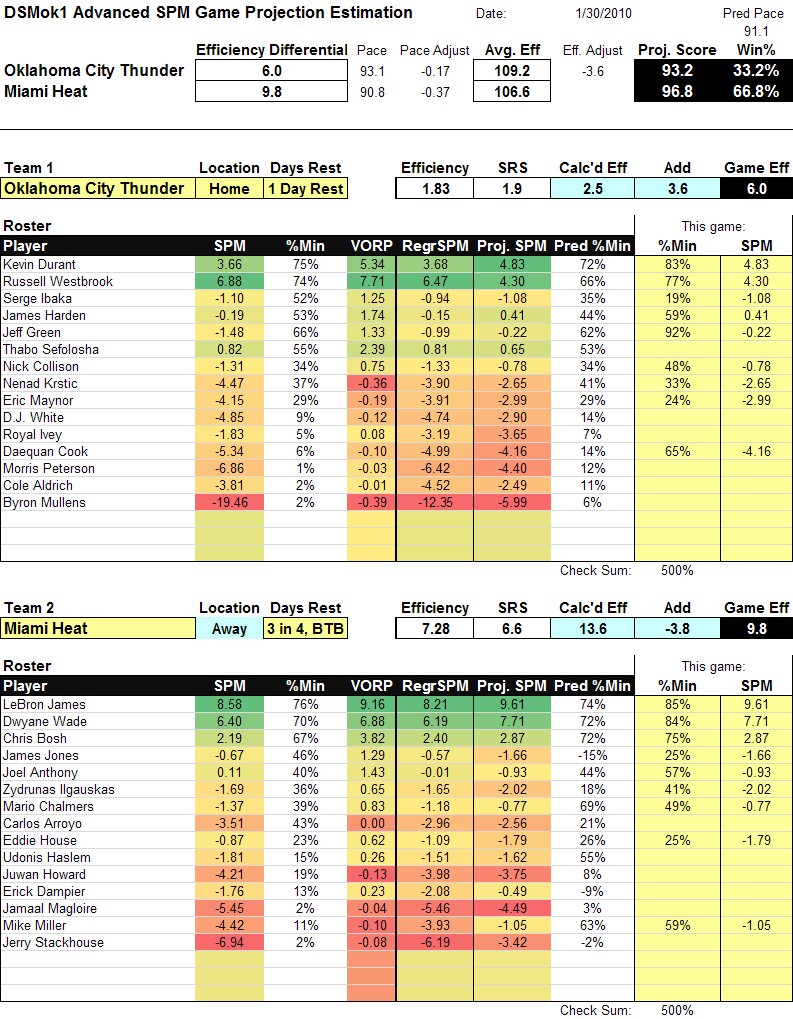
To look at the impact of who was available, I took the minutes each player actually played in the game, multiplied by each player’s true talent Advanced Statistical Plus/Minus (ASPM) (calculated over the last 5 seasons), to estimate the quality of the teams on the floor. Here are the results of that analysis, and thus the pregame prediction for this game:
What do we see? Well, the Heat when at full strength are ridiculously good. They are estimated as a +13.6 team when playing this rotation of players. Of course, since this was a close game against a good team, they maximized the available players–Lebron and Wade better not play 40+ minutes every night. In addition, Spoelstra played a new lineup–he ditched Carlos Arroyo (a good idea) and played Lebron, Wade, and Miller together extensively, with Lebron at point. Kevin Arnovitz explains the change on the Miami Heat Index. Arroyo was the weakest link amongst the regular rotation. Neither he nor Chalmers could really expect to guard Westbrook.
For OKC, the absence of Thabo Sefalosha was a big deal. By ASPM, he is estimated to be the 3rd best player on the team (which would surprise most OKC fans). Harden replaced him, which doesn’t hurt. However, that meant Dequan Cook had to take Harden’s spot in the rotation. Cook is not as good as the other 2; in fact, he is projected as below replacement level. Fortunately for OKC, he turned in a very good game. Nevertheless, the absence of Thabo took OKC from a pregame slight favorite to a pregame 3 point underdog by the ASPM projection method.
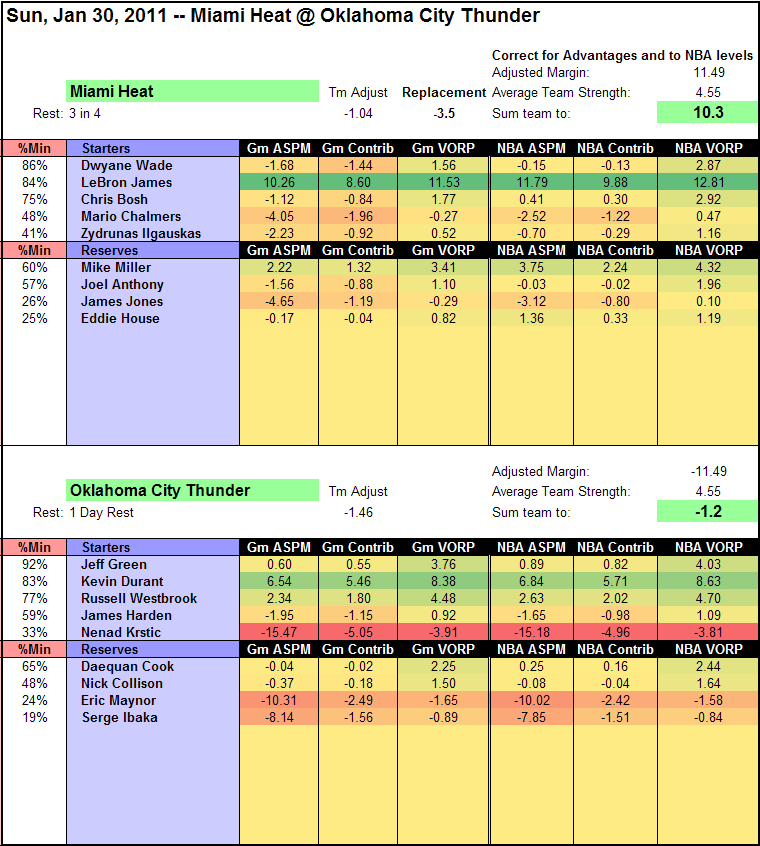
On to the actual game… the game itself was broken down by Royce Young at the Daily Thunder and by the Miami Heat Index team. Let’s look at the ASPM box score.
Very colorful! For Miami, everybody played decent–nobody good, nobody bad–except, of course, for Lebron’s dominant performance.
What did Lebron do? He didn’t shoot any better than Wade or Bosh (61% TS%), but he jammed the box score with big numbers otherwise. 13 assists, 4 rebounds, 4 steals, and 3 blocks, along with only 4 turnovers as the team’s primary ball-handler. That’s really, really, good. MVP good. Good enough to make a great game from Durant look rather bland by comparison.
For OKC–Krstic, Ibaka, and Maynor killed them. Krstic played 15:40, and mustered 1-3 from the field, 2 rebounds, 2 turnovers, and 2 fouls. Ouch. Ibaka played 9 minutes and threw up 0’s across the board, except for 1 block and 2 fouls. Remind me–who is Miami’s center?
And Maynor, as PG, failed to record a point on 4 shots in 12 minutes, though he did put up 3 assists and a steal.
KD played a great game: 33 points on 58% TS%, 10 rebounds, 4 steals, and only 3 turnovers. Very nice. Westbrook played okay, Green was quite solid, Cook surprised…
Why was this game lost by OKC? Besides poor blocking out in the last minute? The failure of Krstic and Ibaka to do ANYTHING against the ragtag bunch of centers they were playing against.
Here is the spreadsheet used to generate this analysis.
Glossary:
- Gm: stat compared to other players in this game–home court, rest, and quality of teams ignored
- NBA: stat compared to NBA average (rest, home court, and quality of teams accounted for)
- %Min: Percent of minutes played
- ASPM: Advanced Statistical Plus/Minus (see threads on APBRmetrics), measuring each player’s value in points per 100 possessions (where 0 is average).
- Contrib: Each player’s contribution to the team, in points per 100 TEAM possessions (if you don’t play, you don’t contribute) (0 is average)
- VORP: Value over replacement player: a replacement player is estimated at -3.5 points per 100 possessions played. If the player is better than that, he has value to the team. Measured in points per 100 TEAM possessions.


Do you have a current link for the google doc? somehow no preview is available…can i still download it?
It is an Excel spreadsheet; Google docs couldn’t handle the file (too complex) other than to host it. You’ll have to download it and use Excel to open it.
wow…I really like the spreadsheet… very thorough…how can the spreadsheet be updated?
For season-level stats, use the “Update Data” button on the “Rosters” tab, after selecting the year in the box directly below the button.
For the box score/single game analysis, there are two ways to select games. First, there is the drop down “Game” selection box, where you can select any game from the 10-11 season. After selecting the game, click the “Download Game Data”.
If you want to do a game from a previous year, you must clear out the “game” selection box and use the “Home”, “Date”, and “Playoff” boxes above to put in the game’s data, before pressing the “Download Game Data” button.
Note: for years before 2010-11, several of the features of the spreadsheet don’t work–contracts don’t match, and the projections are not for that year (I only did projections before the 2010-11 season).
can you send me the spreadsheet? I can’t download it gives me a error site. Thanks Daniel!
This link should take you to the Google Doc, then click download in the upper right corner: https://docs.google.com/leaf?id=0Bx1NfCUslJwxOTc5ZDBiMjctZDk1Mi00OGI3LTk4NmUtMWM1M2ViMjQ4NzQ3&hl=en&pli=1
It’s at 13 MB XLSX file, so it’s too big to email.