 |
APBRmetrics
The statistical revolution will not be televised.
|
| View previous topic :: View next topic |
| Author |
Message |
DC4646
Joined: 27 Oct 2010
Posts: 16
|
 Posted: Thu Dec 02, 2010 12:30 pm Post subject: How Does Offensive Efficiency Change Throughout the Season? Posted: Thu Dec 02, 2010 12:30 pm Post subject: How Does Offensive Efficiency Change Throughout the Season? |
 |
|
Hi all,
Well, the title of the post is pretty self explanatory. I just ran a simple linear regression with week-number (25 weeks in a season) along the x-axis and offensive efficiency along the y-axis. Here is an image of the resulting graph: http://4.bp.blogspot.com/_ldfrs9-ffs0/TPfGIY-BR9I/AAAAAAAAAAM/1TvnxF8EOH0/s1600/offeffgraph2.png.
As you can see, league-wide offensive efficiency goes up as the season goes on. On average, there is a jump of about .16 pts/100possessions each week. r^2=.76.
Here are few important notes:
a). All the data I used came from basketball-reference. I used 10 years of data (it's conceivable that if you go back farther you get a significantly different results, though I personally don't think you would). The averages on the y-axis were computed as follows. Just for the sake of being concrete, I'll look at the first point on the graph. For this point, I computed how many possessions took place, in each game, for the 1st week of the season (10/28-11/5). Using the score of each game and the number of possessions, I computed the offensive efficiency of every team, in each game that took place in the first week. I then averaged the offensive efficiencies. This process was repeated for all 25 weeks of the season.
b). These offensive efficiency numbers represent global averages. For example, the first data point in the graph represents the average offensive efficiency of the entire NBA for the first week of the season. Because these are global averages, defensive efficiency is exactly the same as offensive efficiency (just like how at the end of the season, league-wide offensive efficiency is exactly the same as league-wide defensive efficiency).
c). Because these are global averages and because they were taken over 10-years, this graph doesn't really describe an individual team's offensive efficiency over the course of one season. For one, rarely is a team's offensive efficiency exactly equal to its defensive efficiency. Secondly, league-wide avg offensive efficiency changes from year to year. For example, last year the league-wide avg offensive efficiency was 107.3 pts/100possessions, which is extremely high in the context of the above graph.
Interpretations of the Data:
a). This graph seems to suggest that as the season goes on offense generally improves, while defense gets worse. One possible explanation is that it takes time for offenses to get into the swing of the things (i.e. new players have to be incorporated, coaches have to institute new offenses, rotations aren't set yet, players are still rusty from the off-season...).
b). The data also suggests that offensive efficiency, taken over the course of a season, generally underestimates how good a team's offense is at the end of the season. This is because when you average over the course of the season, among other things, you do penalize a team for slow starts. This bias may or may not be big enough to have a serious effect on inferences one would like to make using season-long average offensive efficiency. Or, the real issue is whether season-long average offensive efficiency underestimates some teams' end-of-season offenses more than it does others. That's the question I am currently investigating. |
|
| Back to top |
|
 |
DSMok1
Joined: 05 Aug 2009
Posts: 611
Location: Where the wind comes sweeping down the plains
|
| Posted: Thu Dec 02, 2010 12:45 pm Post subject: |
|
|
I just posted this graph in another thread last week:
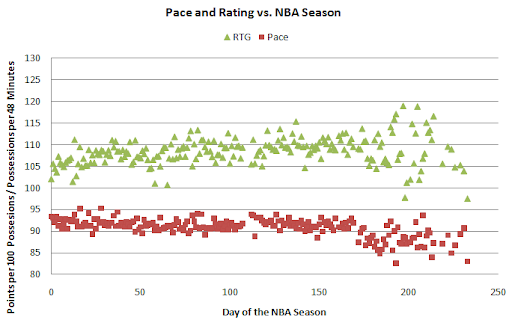
My numbers agree with yours. My data is for the last 3 seasons.
After adjusting for team strengths and rest days, I found that average efficiency increased at 0.026 Points/100Poss/Day. (That multiplies out to 0.18/week, very close to your numbers).
The very low number for the first week of the season could be tied to the number of days off; a similar drop in efficiency was observed in my data for the first game for each team after the all-star break.
_________________
GodismyJudgeOK.com/DStats
Twitter.com/DSMok1
Last edited by DSMok1 on Thu Dec 02, 2010 12:47 pm; edited 1 time in total |
|
| Back to top |
|
|
Mike G
Joined: 14 Jan 2005
Posts: 3597
Location: Hendersonville, NC
|
| Posted: Thu Dec 02, 2010 12:46 pm Post subject: |
|
|
What if you separate the playoff-bound teams from those who have dropped out of the running? It may be that players for lottery teams will slack on defense, while still gunning for impressive offensive stats. This effect would only increase as the year goes on.
And perhaps the opposite effect: greater defensive intensity late in the year among teams vying for playoff seeding.
And then, in playoffs, how have teams fared relative to their competition? There aren't many meaningless games in playoffs.
_________________
`
36% of all statistics are wrong |
|
| Back to top |
|
|
DSMok1
Joined: 05 Aug 2009
Posts: 611
Location: Where the wind comes sweeping down the plains
|
| Posted: Thu Dec 02, 2010 12:49 pm Post subject: |
|
|
| Mike G wrote: | What if you separate the playoff-bound teams from those who have dropped out of the running? It may be that players for lottery teams will slack on defense, while still gunning for impressive offensive stats. This effect would only increase as the year goes on.
And perhaps the opposite effect: greater defensive intensity late in the year among teams vying for playoff seeding.
And then, in playoffs, how have teams fared relative to their competition? There aren't many meaningless games in playoffs. |
In the playoffs, there is a significant drop both in pace and rating.
_________________
GodismyJudgeOK.com/DStats
Twitter.com/DSMok1 |
|
| Back to top |
|
|
Mike G
Joined: 14 Jan 2005
Posts: 3597
Location: Hendersonville, NC
|
| Posted: Thu Dec 02, 2010 12:53 pm Post subject: |
|
|
If ORtg drops in playoffs, even relative to better DRtg opponents, then doesn't that suggest the observed season-long increase in league ORtg may be inflated by some experimental lineups, tanking, sloughing on D, etc?
Even playoff teams may rest their stars in late games, allowing lesser players to run amok on offense. It seems that playoffs are closer to the true gauge of where a team's offense and defense really are, at season's end.
_________________
`
36% of all statistics are wrong |
|
| Back to top |
|
|
DSMok1
Joined: 05 Aug 2009
Posts: 611
Location: Where the wind comes sweeping down the plains
|
| Posted: Thu Dec 02, 2010 2:16 pm Post subject: |
|
|
| Mike G wrote: | If ORtg drops in playoffs, even relative to better DRtg opponents, then doesn't that suggest the observed season-long increase in league ORtg may be inflated by some experimental lineups, tanking, sloughing on D, etc?
Even playoff teams may rest their stars in late games, allowing lesser players to run amok on offense. It seems that playoffs are closer to the true gauge of where a team's offense and defense really are, at season's end. |
You know, I was wrong what I said about rating. It is pace that drops. I just plotted out the results of my regression factoring out team ratings and effect of rest days, and here is the resulting chart:
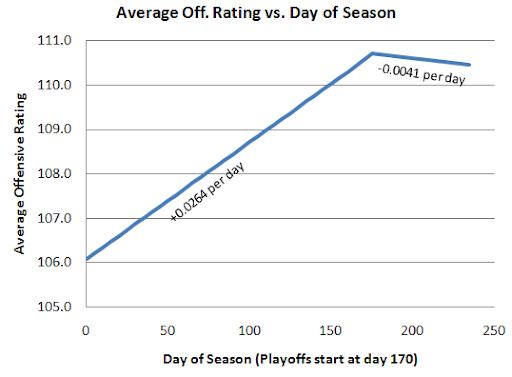
The amazing thing is that the end of the regular season and the beginning of the playoffs just about line up, even though I used a separate modifier for the playoffs. So it doesn't look like there is an issue at all: offenses just get better through the season and then decrease slightly in the playoffs.
_________________
GodismyJudgeOK.com/DStats
Twitter.com/DSMok1 |
|
| Back to top |
|
|
EvanZ
Joined: 22 Nov 2010
Posts: 287
|
|
| Back to top |
|
|
Serhat Ugur (hoopseng)
Joined: 13 Oct 2006
Posts: 209
Location: Basketball Research
|
| Posted: Thu Dec 02, 2010 3:26 pm Post subject: |
|
|
A bit off the topic, I had looked at underdog winning percentages at the end of last year's regular season. I don't know what's your take but I could not detect any trend except for a few weeks.

_________________
http://www.nbastuffer.com
Last edited by Serhat Ugur (hoopseng) on Thu Dec 02, 2010 5:30 pm; edited 3 times in total |
|
| Back to top |
|
|
DSMok1
Joined: 05 Aug 2009
Posts: 611
Location: Where the wind comes sweeping down the plains
|
| Posted: Thu Dec 02, 2010 3:26 pm Post subject: |
|
|
| EvanZ wrote: | | DSMok1 wrote: | | offenses just get better through the season and then decrease slightly in the playoffs. |
Run into tougher defense, right? |
That's accounting for opposing defenses already....
_________________
GodismyJudgeOK.com/DStats
Twitter.com/DSMok1 |
|
| Back to top |
|
|
DC4646
Joined: 27 Oct 2010
Posts: 16
|
| Posted: Thu Dec 02, 2010 4:28 pm Post subject: |
|
|
| Serhat Ugur (hoopseng) wrote: | A bit off the topic, I had looked at underdog winning percentages at the end of last year's regular season. I don't know what's your take but I could not detect any trend.
|
How exactly are you defining "underdog"? |
|
| Back to top |
|
|
Serhat Ugur (hoopseng)
Joined: 13 Oct 2006
Posts: 209
Location: Basketball Research
|
| Posted: Thu Dec 02, 2010 5:28 pm Post subject: |
|
|
| DC4646 wrote: | | Serhat Ugur (hoopseng) wrote: | A bit off the topic, I had looked at underdog winning percentages at the end of last year's regular season. I don't know what's your take but I could not detect any trend.
|
How exactly are you defining "underdog"? |
I'm using point spreads released by sportsbooks for each game.
_________________
http://www.nbastuffer.com |
|
| Back to top |
|
|
DC4646
Joined: 27 Oct 2010
Posts: 16
|
| Posted: Fri Dec 03, 2010 12:22 pm Post subject: |
|
|
@Serhat
I don't know a whole lot about sports betting. Do you think your findings are saying something about Vegas' point spreads or basketball or both?
If you define "underdog" differently, say by using the difference between pt. differential, you might see trends. In fact, you'd almost certainly see a ton of "upsets" early in the season simply because of the high variability of any of the stats one might think of using to define underdog. That would actually be a major problem. |
|
| Back to top |
|
|
DC4646
Joined: 27 Oct 2010
Posts: 16
|
| Posted: Fri Dec 03, 2010 12:42 pm Post subject: |
|
|
@DSMok1:
I'm glad our numbers are close. To be honest, I'm just sort of getting used to R. At the back of my head, I felt like there was a small chance that I might have plugged in a few numbers wrong. And, my findings would be totally off. And, the study of basketball statistics would be set back 20 years.
p.s.
What software do most people use for basketball statistics? I'm using R mostly because I'm planning on going into biostatistics and I know that I'll probably eventually need to learn R. |
|
| Back to top |
|
|
DC4646
Joined: 27 Oct 2010
Posts: 16
|
| Posted: Fri Dec 03, 2010 1:02 pm Post subject: |
|
|
Going back to this sentence in my original post: "I used 10 years of data (it's conceivable that if you go back farther you get a significantly different results, though I personally don't think you would)." More precisely, I used data from the last 10 seasons.
I just ran the same study for data from 1990-1999, I actually did get (kind of) significantly different results. The graph is here: http://3.bp.blogspot.com/_ldfrs9-ffs0/TPkpKGN9NqI/AAAAAAAAAAQ/w8eMeptTW-s/s1600/offeffgraph1999.png.
For the sake of comparison, the graph for data from 1999-2010 is here:http://4.bp.blogspot.com/_ldfrs9-ffs0/TPfGIY-BR9I/AAAAAAAAAAM/1TvnxF8EOH0/s1600/offeffgraph2.png
In the graph using data from 1999-2010, each week there was a jump of .16 pts/100posession. In the graph from 1990-1999, each week there was a jump of only .08 pts/100possessions. r^2 in old graph was .76. r^2 in the new graph is only .4.
I want to say hand-checking rules have something to do with the difference, but that's not really based on anything. Or, maybe it has something to do with parity issues before the 1999 CBA. |
|
| Back to top |
|
|
DSMok1
Joined: 05 Aug 2009
Posts: 611
Location: Where the wind comes sweeping down the plains
|
| Posted: Fri Dec 03, 2010 1:09 pm Post subject: |
|
|
| DC4646 wrote: | @DSMok1:
I'm glad our numbers are close. To be honest, I'm just sort of getting used to R. At the back of my head, I felt like there was a small chance that I might have plugged in a few numbers wrong. And, my findings would be totally off. And, the study of basketball statistics would be set back 20 years.
p.s.
What software do most people use for basketball statistics? I'm using R mostly because I'm planning on going into biostatistics and I know that I'll probably eventually need to learn R. |
I primarily just use Excel. You can do just about anything with it.
I've dabbled in R, and when I get more into Adjusted Plus/Minus calculations, I'll have to. I think R is probably the way to go.
_________________
GodismyJudgeOK.com/DStats
Twitter.com/DSMok1 |
|
| Back to top |
|
|
|
|
You cannot post new topics in this forum
You cannot reply to topics in this forum
You cannot edit your posts in this forum
You cannot delete your posts in this forum
You cannot vote in polls in this forum
|
Powered by phpBB © 2001, 2005 phpBB Group
|

