 |
APBRmetrics
The statistical revolution will not be televised.
|
| View previous topic :: View next topic |
| Author |
Message |
DSMok1
Joined: 05 Aug 2009
Posts: 611
Location: Where the wind comes sweeping down the plains
|
 Posted: Wed Jul 14, 2010 4:39 pm Post subject: Advanced Statistical Plus/Minus Posted: Wed Jul 14, 2010 4:39 pm Post subject: Advanced Statistical Plus/Minus |
 |
|
Advanced Statistical Plus/Minus
I've been working on deriving a new SPM regression based purely upon "advanced" stats (like TS% and OR%) for some time now. I feel comfortable enough with the results thus far to release the first iteration of this SPM.
The data used: Neil Paine's collection of 1-Yr APM's (unfortunately without std err's; I estimated the standard errors for weighting purposes), Joe Sill's 4 Year RAPM's, with the regression toward 0 backed out, and finally (and most importantly) Steve Ilardi's 6-Year APM's posted on this forum. These 6 Year APM's had quite low errors, and provided the groundwork for this regression. I weighted each player in the regression by 1/stderr^2, where stderr is their APM standard error.
I then compiled the advanced metrics from the Basketball Reference Play Index for each player, and weighted-averaged the multi-year data (including playoffs, for the APM's that included those). Thus I have 3 APM data sets and the associated advanced statistics.
I experimented with a number of constructions for the rebounding and especially the scoring parts of this regression. Finding a good way to relate turnovers, shooting, usage, and assists proved illusive for some time. I finally now have a construction I am comfortable with, though (like with any construction) there are a few holes.
To avoid over-weighting steals and blocks for defense, I also included offensive rating and defensive rating of the teams. This is not included in the final SPM, because the team adjustment (to make the teams sum to their efficiency differentials) already accounts for this.
Here are the factors in this regression:
| Code: | Factor Value
TRB% 1.33823090
TRB^2 -0.08918572
TRB^3 0.00219790
STL% 1.43951052
BLK% 0.35237880
MPG 0.10099403
TO% Coeff 0.66920540
PPP Threshold 1.64758151
PPP USG Scale 0.01394727
PPP AST Scale 0.01005596
Scoring 0.55728095
USG Const 4.67604494
Intercept -6.90680060 |
Let me explain.
First of all, note the rebounding terms. I discovered that the value of splitting rebounding into offensive and defensive was much less than that of adding this nonlinearity (which didn't work when ORB and DRB were split). Basically, in the neighborhood of 10%, there isn't a huge amount of change. A player that gets very few rebound hurts the team a lot, and a player near 20% rebounds helps quite a bit. Here's a quick table:
| Code: | TRB% Pts
0 0.00
2.5 2.82
5 4.74
7.5 5.95
10 6.66
12.5 7.09
15 7.42
17.5 7.89
20 8.67
22.5 10.00
25 12.06 |
Next: steals, blocks and MPG. These are all straightforward, linear terms. Be aware, though: I'm inputing these percentages throughout in their whole-number forms, like Basketball-Reference outputs them.
Charges taken would be added into the steals term--other research I've done shows them to be equivalent in SPM terms (1 ChgTkn = 1 Steal). I'm trying to make this SPM able to be applied historically; thus I've left that out.
Here's the complicated part: the scoring term. First the actual formula:
| Code: | | {TS%*2*(1-TO%/100) - TO%Coeff*(TO%/100) - (PPPThreshold - PPPUSGScale*USG% - PPPASTScale*AST%)}*(USG% + USGConst)*Scoring |
What's going on here? First of all, this is basically an efficiency*USG term. It takes into account TS%, USG%, TO%, and AST% to create a composite scoring value.
Now, term by term. The True Shooting term is very basic. It gives the number of points scored per possession used by the player. Next, the turnover term provides the penalty for each turnover. These terms make up the efficiency side of the equation.
Next, the PPP (Points per Possession) threshold and modifiers. The threshold is just a baseline constant. Then usage is subtracted out, indicating from the regression that there is a clear benefit to having a higher usage--in fact, .1 PPP per 7 %USG increased. Finally, the assist modifier. This is the ONLY place in the regression that has assists included. It was not significant anywhere else I tried it, compared to this location in the regression. Assists also modify the PPP; when everything is multiplied through the assists basically go to the form AST%*(USG%+Constant), which is a reasonable construction.
Finally, the whole (PPP - PPPThreshold) term is multiplied by (USG% + USGConst). Again, we're using whole percentages, everywhere but with TS% (I'm following Basketball Reference on this). Because of the USGConst, even if a player has NO usage, he still gets some credit for assists. Just not very much. In other words, Steve Blake just isn't that great.
Finally, after compiling the RAW SPM, the team adjustment must be applied. This can range from negligible (Cleveland, Boston, and Utah had 0 team adjustments this year) to quite large (+1.36 for ORL, -1.43 for GSW). Mostly defense is what is accounted for by the team adjustment since it is not captured well by the regression.
Here is a sample of the results--the top 20 in SPM, minimum 1000 minutes:
| Code: | Rnk Tm Player G MP SPM
1 CLE LeBron James 76 2966 12.16
2 MIA Dwyane Wade 77 2792 9.69
3 NOH Chris Paul 45 1712 6.51
4 ORL Dwight Howard 82 2843 6.31
5 SAS Manu Ginobili 75 2150 5.57
6 LAL Kobe Bryant 73 2835 5.38
7 OKC Kevin Durant 82 3239 5.32
8 SAS Tim Duncan 78 2438 5.21
9 BOS Rajon Rondo 81 2963 4.82
10 LAC Marcus Camby 51 1596 4.81
11 UTA Deron Williams 76 2802 4.42
12 ATL Josh Smith 81 2871 4.32
13 DAL Dirk Nowitzki 81 3039 4.07
14 LAL Pau Gasol 65 2403 4.01
15 UTA Carlos Boozer 78 2673 3.99
16 WAS Gilbert Arenas 32 1169 3.90
17 DEN Nene Hilario 82 2755 3.77
18 TOR Chris Bosh 70 2526 3.62
19 CHA Gerald Wallace 76 3119 3.53
20 DEN Carmelo Anthony 69 2634 3.51 |
The full results for 2009-2010 regular season are here: Google Spreadsheet: Advanced SPM 09-10
EDIT: See later in this thread for revisions to this method and a complete spreadsheet to play with.
Last edited by DSMok1 on Tue Oct 26, 2010 12:11 pm; edited 1 time in total |
|
| Back to top |
|
 |
Ilardi
Joined: 15 May 2008
Posts: 265
Location: Lawrence, KS
|
| Posted: Wed Jul 14, 2010 4:55 pm Post subject: |
|
|
Nice work, DSM: this looks like an important contribution.
A couple of quick questions:
a) Can you provide standard error (se) estimates for the SPM values?
b) Did you consider using any of the advanced metrics from 82games? I've always thought eFG% Allowed would be quite useful in an SPM model . . .
c) What is the correlation between your SPM values for each player and his corresponding APM value? (i.e., the zero-order correlation for the entire league)
d) Any plans for "out-of-sample testing" on this new SPM metric (a la Joe Sill)? |
|
| Back to top |
|
|
DSMok1
Joined: 05 Aug 2009
Posts: 611
Location: Where the wind comes sweeping down the plains
|
| Posted: Wed Jul 14, 2010 5:38 pm Post subject: |
|
|
| Ilardi wrote: | Nice work, DSM: this looks like an important contribution.
A couple of quick questions:
a) Can you provide standard error (se) estimates for the SPM values?
b) Did you consider using any of the advanced metrics from 82games? I've always thought eFG% Allowed would be quite useful in an SPM model . . .
c) What is the correlation between your SPM values for each player and his corresponding APM value? (i.e., the zero-order correlation for the entire league)
d) Any plans for "out-of-sample testing" on this new SPM metric (a la Joe Sill)? |
Good to see you around, Ilardi!
a) How would I go about developing them for a nonlinear model? I would love to, but haven't figured out how. Another issue with the standard errors is that the APM against which we are regressing has error within it (which I think biases the error on the regression upwards).
b) I wanted to make this metric as useful historically as possible. Basketball Reference has all of the stats used in this regression back to 1977. A more intricate SPM is possible, using things like eFG% allowed, location of assists, etc.
c) I can run that... should I do it just on the low-error six season sample?
d) That would be tough for me to do. I don't have a lot of samples to work with.
Thanks for the input! |
|
| Back to top |
|
|
Ilardi
Joined: 15 May 2008
Posts: 265
Location: Lawrence, KS
|
| Posted: Wed Jul 14, 2010 6:01 pm Post subject: |
|
|
Thanks: and most guys on the forum call me 'Steve'.
I'd have to get a consult to figure out how to calculate se's on a nonlinear metric like that, but I know it must be do-able. Perhaps someone on this forum can point the way to a workable approach?
As for the correlation between SPM and APM, I might suggest using the 08-09 season, for which you have my 6-season estimates (weighted heavily toward 08-09), as well as your own SPM values.
On the out-of-sample test: presumably it would be possible to calculate SPM values for each player based on games through, say, the first 4 months of last season, and then use those estimates to predict results of the final 2 months. (Same basic approach Joe used with his ridge regression APM numbers.) It would be a fair amount of work, but should be easily do-able, at least in principle. |
|
| Back to top |
|
|
DSMok1
Joined: 05 Aug 2009
Posts: 611
Location: Where the wind comes sweeping down the plains
|
| Posted: Wed Jul 14, 2010 11:47 pm Post subject: |
|
|
| Ilardi wrote: | Thanks: and most guys on the forum call me 'Steve'.
I'd have to get a consult to figure out how to calculate se's on a nonlinear metric like that, but I know it must be do-able. Perhaps someone on this forum can point the way to a workable approach?
As for the correlation between SPM and APM, I might suggest using the 08-09 season, for which you have my 6-season estimates (weighted heavily toward 08-09), as well as your own SPM values.
On the out-of-sample test: presumably it would be possible to calculate SPM values for each player based on games through, say, the first 4 months of last season, and then use those estimates to predict results of the final 2 months. (Same basic approach Joe used with his ridge regression APM numbers.) It would be a fair amount of work, but should be easily do-able, at least in principle. |
I'd love to figure out how to do standard errors on nonlinear metrics.
I'll look into the correlation for the data you suggested, when I have time.
I still have issues with the out of sample test, because it is replacing a descriptive stat with a predictive stat--which is why the ridge regression technique provided the best out-of-sample results. It's basically regression to the mean. When I do regression, I'm going to use the samples, with their error, and regress in a Bayesian manner toward a prior based on peripheral data. |
|
| Back to top |
|
|
Ilardi
Joined: 15 May 2008
Posts: 265
Location: Lawrence, KS
|
| Posted: Thu Jul 15, 2010 12:18 pm Post subject: |
|
|
| DSMok1 wrote: | | I still have issues with the out of sample test, because it is replacing a descriptive stat with a predictive stat--which is why the ridge regression technique provided the best out-of-sample results. It's basically regression to the mean. When I do regression, I'm going to use the samples, with their error, and regress in a Bayesian manner toward a prior based on peripheral data. |
But isn't the utility of any metric linked in large part to its predictive ability? Certainly, in the natural sciences, the valid prediction of phenomena is regarded as the sine qua non of the entire enterprise, so I'm admittedly a bit biased, but suffice it to say that even NBA decision makers realize that it's much more valuable to have a stat that gives accurate prediction than one that merely provides accurate description.
Also, although ridge regression makes use of 'regression to the mean', it does so in a limited way - essentially by simply reining in outlier values via an a priori (Bayesian) determination that they are unlikely. In my view, it's an extremely clever technique for enhancing the 'signal' of player APM values via tamping down the 'noise' of extreme variations in efficiency from one low-minute lineup to another. |
|
| Back to top |
|
|
DSMok1
Joined: 05 Aug 2009
Posts: 611
Location: Where the wind comes sweeping down the plains
|
| Posted: Thu Jul 15, 2010 1:00 pm Post subject: |
|
|
| Ilardi wrote: | | DSMok1 wrote: | | I still have issues with the out of sample test, because it is replacing a descriptive stat with a predictive stat--which is why the ridge regression technique provided the best out-of-sample results. It's basically regression to the mean. When I do regression, I'm going to use the samples, with their error, and regress in a Bayesian manner toward a prior based on peripheral data. |
But isn't the utility of any metric linked in large part to its predictive ability? Certainly, in the natural sciences, the valid prediction of phenomena is regarded as the sine qua non of the entire enterprise, so I'm admittedly a bit biased, but suffice it to say that even NBA decision makers realize that it's much more valuable to have a stat that gives accurate prediction than one that merely provides accurate description.
Also, although ridge regression makes use of 'regression to the mean', it does so in a limited way - essentially by simply reining in outlier values via an a priori (Bayesian) determination that they are unlikely. In my view, it's an extremely clever technique for enhancing the 'signal' of player APM values via tamping down the 'noise' of extreme variations in efficiency from one low-minute lineup to another. |
I'm not disputing the value of prediction. However, I'd like to do that AFTER the SPM is calculated. In other words, construct a SPM, THEN apply the Bayesian regression to estimate "true talent", then combine with previous years to create a projection. I simply want the SPM itself to not be "biased" with information outside of actual production numbers.
I agree that RAPM works very well, but it does have a few quirks. Like Anderson Varajao getting very highly rated because it is so unlikely that Lebron is really a +11 player. |
|
| Back to top |
|
|
Ilardi
Joined: 15 May 2008
Posts: 265
Location: Lawrence, KS
|
| Posted: Sat Jul 17, 2010 10:40 am Post subject: |
|
|
| I've also had Varajao rated highly using a more traditional APM approach . . . |
|
| Back to top |
|
|
DSMok1
Joined: 05 Aug 2009
Posts: 611
Location: Where the wind comes sweeping down the plains
|
| Posted: Sat Jul 17, 2010 12:27 pm Post subject: |
|
|
| Ilardi wrote: | | I've also had Varajao rated highly using a more traditional APM approach . . . |
15th is pretty high. That's what the 4-year RAPM had him. Don't you think there is possibility of using the Bayesian in such a way causing some odd effects like that?
Also--would it be possible to get from you a 4 year, regular season only APM, though 09-10? Then I could use the advanced stats collected by Hoopdata in that time to run a more comprehensive SPM.
_________________
GodismyJudgeOK.com/DStats
Twitter.com/DSMok1 |
|
| Back to top |
|
|
Neil Paine
Joined: 13 Oct 2005
Posts: 774
Location: Atlanta, GA
|
| Posted: Sat Jul 17, 2010 2:50 pm Post subject: |
|
|
Great work, DSMok!! I'm trying to replicate your work, and I had a question: how are you doing the team adjustment? What I always did was to find the minute-weighted average of each team's SPM and multiply by 5, then subtract that from the team's actual efficiency differential and divide the result by 5. But when I do that, my team adjustments don't match yours (ORL is +1.26, GSW is -1.70). Is it a rounding issue (I'm using the full, calculated versions of the BBR stats, while you used rounded versions), or is my team adjustment method incorrect?
_________________
http://www.basketball-reference.com/blog/ |
|
| Back to top |
|
|
DSMok1
Joined: 05 Aug 2009
Posts: 611
Location: Where the wind comes sweeping down the plains
|
| Posted: Sat Jul 17, 2010 4:02 pm Post subject: |
|
|
| Neil Paine wrote: | | Great work, DSMok!! I'm trying to replicate your work, and I had a question: how are you doing the team adjustment? What I always did was to find the minute-weighted average of each team's SPM and multiply by 5, then subtract that from the team's actual efficiency differential and divide the result by 5. But when I do that, my team adjustments don't match yours (ORL is +1.26, GSW is -1.70). Is it a rounding issue (I'm using the full, calculated versions of the BBR stats, while you used rounded versions), or is my team adjustment method incorrect? |
I didn't use the team efficiency precisely. I summed to 2/3 SRS 1/3 Efficiency differential. Is the SRS calculated from efficiency differentials or point margins? If it is calculated off of efficiency differentials per game, it should be the best thing to sum to. I think it's point differential, which is why I used the average I did. But whatever you choose to sum to, that's up to you.
I'm glad you're doing this! You've got all of the data for compiling a full list and actually doing the team adjustments correctly.
I'm hoping this doesn't undervalue great centers--because there weren't any in the time period I used for the regression, I don't know if the top end of the regression can capture them. Then again, I don't know how much a great center truly contributed, either.
_________________
GodismyJudgeOK.com/DStats
Twitter.com/DSMok1 |
|
| Back to top |
|
|
Ilardi
Joined: 15 May 2008
Posts: 265
Location: Lawrence, KS
|
| Posted: Sat Jul 17, 2010 4:59 pm Post subject: |
|
|
[quote="DSMok1"] | Ilardi wrote: |
Also--would it be possible to get from you a 4 year, regular season only APM, though 09-10? Then I could use the advanced stats collected by Hoopdata in that time to run a more comprehensive SPM. |
I haven't run it yet, but maybe your request will be just the catalyst I need. Is it really the case that no one else out there has put out any publicly available multi-year APM stats? Are Aaron's 2-year APM stats on basketballvalue.com all there is? If that's the case, I really will try to carve out the time to work on this . . . |
|
| Back to top |
|
|
DSMok1
Joined: 05 Aug 2009
Posts: 611
Location: Where the wind comes sweeping down the plains
|
| Posted: Sat Jul 17, 2010 5:28 pm Post subject: |
|
|
| Ilardi wrote: | | DSMok1 wrote: |
Also--would it be possible to get from you a 4 year, regular season only APM, though 09-10? Then I could use the advanced stats collected by Hoopdata in that time to run a more comprehensive SPM. |
I haven't run it yet, but maybe your request will be just the catalyst I need. Is it really the case that no one else out there has put out any publicly available multi-year APM stats? Are Aaron's 2-year APM stats on basketballvalue.com all there is? If that's the case, I really will try to carve out the time to work on this . . . |
I don't know of any other APM's out there, now that the RAPM was taken down. The one I could use would be an "average" APM over the last 4 years.
_________________
GodismyJudgeOK.com/DStats
Twitter.com/DSMok1 |
|
| Back to top |
|
|
DSMok1
Joined: 05 Aug 2009
Posts: 611
Location: Where the wind comes sweeping down the plains
|
| Posted: Mon Jul 19, 2010 9:53 am Post subject: |
|
|
| Neil Paine wrote: | Yeah, SRS is actually just SOS-adjusted point differential per game, which means it's not tempo-independent (we do it that way because we only have game possessions going back to 1986-87). If we had historical SOS-adjusted efficiency differential, that would definitely be the thing to sum to, but since we don't, I'm probably going to just sum to efficiency differential (which is what APM does anyway).
In case I didn't say so, like this new regression a lot! The most glaring problem with the old regression was that it drastically overvalued assists (and therefore PGs -- I found that the average PG was +1 or so while every other position was near zero), but it looks like you fixed this by tying AST% to the scoring term instead of having it stand alone. I would imagine this retrodicts better than the old regression as a result.
...
One troubling result at a first glance is that Dennis Rodman's 1995 is +10.91, one of the greatest seasons of all time... Maybe the rebounding term needs to be re-evaluated?
|
(Posted from an email)
It looks like the rebounding term will need some more work. The cubic works for just about everyone, except Rodman. He breaks the regression. The 30% TRB% is way out into the nonlinear term, and is worth like 9 points more than D-Howard's 22% TRB%.
Here are a few possibilities:
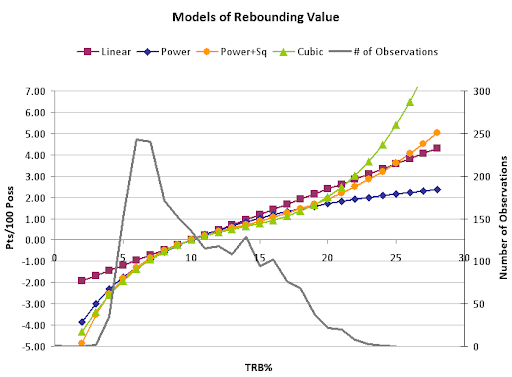
The cubic is the best fit, but only by a hair. The power + Sq is very close in terms of fit, and would probably be my pick to use. The pure power curve can't capture the desired up-turn at higher TRB% rates, but in terms of fit is still very close to power+Sq (most of the difference is out where there aren't any observations). The linear is here for reference (incidentally, TRB% by itself is a BETTER fit than ORB% and DRB% split out).
_________________
GodismyJudgeOK.com/DStats
Twitter.com/DSMok1 |
|
| Back to top |
|
|
Mike G
Joined: 14 Jan 2005
Posts: 3618
Location: Hendersonville, NC
|
| Posted: Mon Jul 19, 2010 10:19 am Post subject: |
|
|
| DSMok1 wrote: | ...
I'm hoping this doesn't undervalue great centers... |
This is reminiscent of a discussion starting with Nazr Mohammed (this year), that many of his rates resembled prime Moses, Gilmore, and others. Low versatility index the likely culprit.
It was asked then whether those known greats were also undervalued by the (then most current) SPM method.
If versatile less-than-great centers (Divac, Daugherty) seem to be better than Moses or Artis, then maybe it needs to be fixed?
_________________
`
36% of all statistics are wrong |
|
| Back to top |
|
|
|
|
You cannot post new topics in this forum
You cannot reply to topics in this forum
You cannot edit your posts in this forum
You cannot delete your posts in this forum
You cannot vote in polls in this forum
|
Powered by phpBB © 2001, 2005 phpBB Group
|

