 |
APBRmetrics
The statistical revolution will not be televised.
|
| View previous topic :: View next topic |
| Author |
Message |
DSMok1
Joined: 05 Aug 2009
Posts: 610
Location: Where the wind comes sweeping down the plains
|
 Posted: Fri Jul 02, 2010 12:54 pm Post subject: Musings on Win Shares, Aging Curves, and Replacement Levels Posted: Fri Jul 02, 2010 12:54 pm Post subject: Musings on Win Shares, Aging Curves, and Replacement Levels |
 |
|
I've been pondering win shares as a proxy for all other 1 number evaluation metrics, and have worked on some additional research in a couple of areas.
First: mean performance, in terms of WS/48. I wanted to get a mean value for a Bayesian prior, based on non-statistical inputs. After a lot of experimentation, I settled on using 3 inputs: Team Efficiency Differential, player Minutes Per Game, and Age.
This chart shows the results:
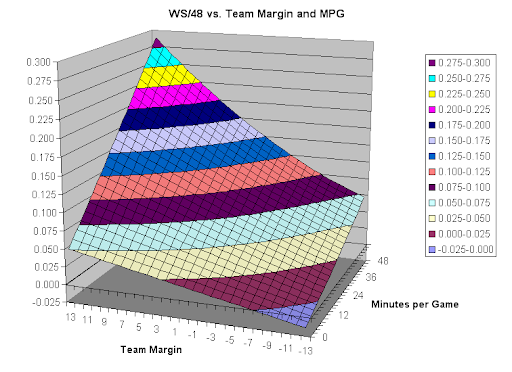
(Age is set to 27 for this chart.)
What does this show? Basically it states what is well known in chart form. The better the team is, the better a player playing minutes for them will be. The worse the team is, the worse the low-minutes guys will be. "Replacement Level" is .025; note it's position on the graph. If your team is above league average, you won't be playing replacement level players even for 1 MPG (at least not likely).
The age adjustment was independent of MPG and Team Margin. Basically, if a player was younger, he probably wasn't as good (given a specific MPG on a specific quality of team). Younger players are given the benefit of the doubt a little--they are played a bit more than their quality would say they ought to be. However, the effect in these terms is minimal. A young player is only expected to be about .003 worse than a veteran getting the same playing time. Basically negligible.
The overall regression looked like this:
| Code: | Coeff Value
TeamMar 0.002496902595
MPG 0.003064042160
MPG*TeamMar 0.000121489052
MPG^2 -0.000003875497
MPG*TeamMar^2 0.000000060037
Age 0.001068992625
Age^2 -0.000016585885
Intercept 0.001736267696 |
(Obviously, the coefficients aren't that precise--just for completeness' sake.)
What can this be used for? A Bayesian estimation for a player's WS/48 for a given season, based on his playing time, age, and the quality of team he plays for.
What I haven't figured out yet is how many minutes of this "prior" to add in to a weighted average. I used 200 and the results looked good. That may be too much. Still, it neatly regressed the 100 minute outliers.
Also, a note on the MPG-- I adjusted players that had fewer than 15 MPG to a minimum of 75 games, to account for players that didn't play in many games but averaged, say, 10 MPG.
Here are the top player-seasons (regular seasons) since 1980, by regressed WS/48:
| Code: | Rnk Player Season Age Tm G MP PER WS WS/48 MPG Tm Mar Exp.WS/48 Regressed WS/48
1 Michael Jordan 1991 27 CHI 82 3034 31.6 20.3 0.321 37.0 9.4 0.200 0.313
2 Michael Jordan 1996 32 CHI 82 3090 29.4 20.4 0.317 37.7 13.4 0.239 0.312
3 LeBron James 2009 24 CLE 81 3054 31.7 20.3 0.318 37.7 10.0 0.207 0.311
4 Michael Jordan 1988 24 CHI 82 3311 31.7 21.2 0.308 40.4 3.5 0.162 0.300
5 LeBron James 2010 25 CLE 76 2966 31.1 18.5 0.299 39.0 7.1 0.188 0.292
6 David Robinson 1994 28 SAS 80 3241 30.7 20.0 0.296 40.5 5.8 0.183 0.289
7 Michael Jordan 1989 25 CHI 81 3255 31.1 19.8 0.292 40.2 1.4 0.145 0.284
8 David Robinson 1996 30 SAS 82 3019 29.4 18.3 0.290 36.8 6.7 0.177 0.283
9 Chris Paul 2009 23 NOH 78 3002 30.0 18.3 0.292 38.5 1.7 0.142 0.283
10 Michael Jordan 1997 33 CHI 82 3106 27.8 18.3 0.283 37.9 12.0 0.227 0.280
11 Shaquille O'Neal 2000 27 LAL 79 3163 30.6 18.6 0.283 40.0 9.1 0.210 0.279
12 Michael Jordan 1990 26 CHI 82 3197 31.2 19.0 0.285 39.0 3.3 0.157 0.277
13 Chris Paul 2008 22 NOH 80 3006 28.3 17.8 0.284 37.6 5.8 0.171 0.277
14 Dirk Nowitzki 2007 28 DAL 78 2821 27.6 16.3 0.278 36.2 8.1 0.185 0.272
15 Michael Jordan 1992 28 CHI 80 3102 27.7 17.7 0.274 38.8 11.0 0.222 0.271
16 Dirk Nowitzki 2006 27 DAL 81 3089 28.1 17.7 0.275 38.1 6.8 0.182 0.269
17 David Robinson 1995 29 SAS 81 3074 29.1 17.5 0.273 38.0 6.3 0.178 0.267
18 Kevin Garnett 2004 27 MIN 82 3231 29.4 18.3 0.272 39.4 6.2 0.182 0.267
19 Michael Jordan 1993 29 CHI 78 3067 29.7 17.2 0.270 39.3 6.8 0.187 0.265
20 Magic Johnson 1990 30 LAL 79 2937 26.6 16.5 0.270 37.2 7.0 0.181 0.264
21 Karl Malone 1997 33 UTA 82 2998 28.9 16.7 0.268 36.6 9.6 0.200 0.264
22 Charles Barkley 1990 26 PHI 79 3085 27.1 17.3 0.269 39.1 5.1 0.171 0.263
23 Magic Johnson 1989 29 LAL 77 2886 26.9 16.1 0.267 37.5 7.1 0.182 0.262
24 David Robinson 1998 32 SAS 73 2457 27.8 13.8 0.269 33.7 4.4 0.148 0.260
25 Kevin Garnett 2008 31 BOS 71 2328 25.3 12.9 0.265 32.8 11.3 0.197 0.260 |
This year's top 15:
| Code: | Rank Player Age Tm G MP WS WS/48 Exp. WS/48 Regressed WS/48
1 LeBron James 25 CLE 76 2966 18.5 0.299 0.188 0.292
2 Kevin Durant 21 OKC 82 3239 16.1 0.238 0.160 0.233
3 Dwight Howard 24 ORL 82 2843 13.2 0.223 0.178 0.220
4 Dwyane Wade 28 MIA 77 2792 13 0.224 0.142 0.219
5 Pau Gasol 29 LAL 65 2403 11 0.22 0.165 0.216
6 Tim Duncan 33 SAS 78 2438 10.9 0.215 0.147 0.210
7 Manu Ginobili 32 SAS 75 2150 9.7 0.216 0.138 0.209
8 Chris Paul 24 NOH 45 1712 7.3 0.204 0.110 0.194
9 Dirk Nowitzki 31 DAL 81 3039 12.3 0.194 0.150 0.191
10 Nene Hilario 27 DEN 82 2755 10.8 0.188 0.147 0.185
11 Greg Oden 22 POR 21 502 2.2 0.214 0.109 0.184
12 Andrew Bynum 22 LAL 65 1977 7.8 0.188 0.140 0.184
13 Al Horford 23 ATL 81 2845 10.9 0.183 0.158 0.181
14 Chauncey Billups 33 DEN 73 2490 9.5 0.182 0.149 0.180
15 Amare Stoudemire 27 PHO 82 2838 10.7 0.181 0.156 0.179 |
Next post: Aging Curves. |
|
| Back to top |
|
 |
DSMok1
Joined: 05 Aug 2009
Posts: 610
Location: Where the wind comes sweeping down the plains
|
| Posted: Fri Jul 02, 2010 1:50 pm Post subject: |
|
|
Here is some rough work on WS/48 aging curves.
I followed the procedure outlined here: http://www.insidethebook.com/ee/index.php/site/article/basic_aging_curve_for_hitters_1957_2006/
Obviously, survivor bias is a huge issue, and one I don't fully know how to compensate for.
I used matched pairs of all players that had 100 MPG in both years. The fact that a player had 100 MPG in each year biases the older sample towards decline, since in order for a player to get 100 MPG in Y+1 he had to perform to a certain level in Y, perhaps even be lucky. The same is true in early years, biasing towards increase, though not so badly.
To try to solve this, I regressed the first year results, using the 200 minutes of expected WS/48, and compared that to the unadjusted second year results.
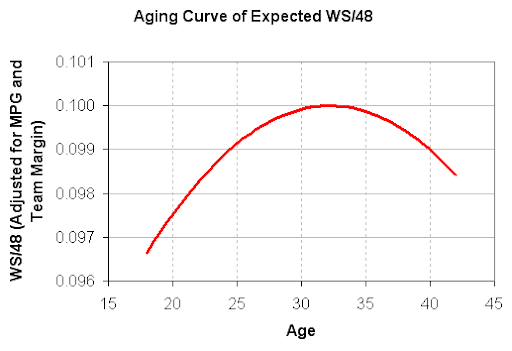
Here is the aging curve, showing raw WS/48 and the regressed WS/48. I'm not sure if I regressed the right way....

I'm showing the peak is at 26, rather than 27. That said, I like the looks of the regressed curve, particularly when compared to the minutes we see at each age. If the number of minutes starts to drop significantly at age 27, the players are probably passing their peak. I do expect the minutes to peak earlier than the players themselves, as players in development are given more minutes because of potential improvement.
Note I normalized these curves so the peaks would be at 0.100. In other words: if a player is at a true talent of 0.175 at age 25, he would be projected to be at 0.161 at age 30.
Here are the actual numbers, both for the Raw WS/48 and the Adjusted WS/48:
| Code: | Age Eff. Min Raw Regressed Curve
18 2648 -0.024 -0.032 -0.028
19 34629 0.016 0.008 0.006
20 126201 0.037 0.032 0.034
21 277620 0.057 0.057 0.056
22 624441 0.071 0.072 0.073
23 1055516 0.085 0.088 0.085
24 1279689 0.092 0.094 0.093
25 1334885 0.096 0.098 0.098
26 1332637 0.099 0.100 0.100
27 1284283 0.100 0.098 0.099
28 1186896 0.099 0.095 0.096
29 1062218 0.096 0.091 0.091
30 905080 0.092 0.085 0.085
31 729743 0.086 0.076 0.077
32 567531 0.078 0.070 0.067
33 429684 0.074 0.060 0.057
34 308454 0.063 0.045 0.046
35 201169 0.053 0.037 0.035
36 123215 0.042 0.025 0.022
37 71096 0.029 0.008 0.009
38 38210 0.011 -0.010 -0.005
39 20366 -0.002 -0.016 -0.019
40 8667 -0.010 -0.041 -0.035
41 3240 -0.015 -0.065 -0.051
42 1077 -0.048 -0.071 -0.069
43 296 -0.035 -0.041 -0.088 |
I recommend using the "curve" numbers; the curve is a 4th-order polynomial, fitted to the Regressed data, weighted the square root of the Effective Minutes (which aren't actual minutes played).
The equation of the curve:
| Code: | -2.7188227611 Intercept
0.3199248445 Age
-0.0132504155 Age^2
0.0002404433 Age^3
-0.0000016798 Age^4 |
Please evaluate whether I have regressed appropriately.... this survivor bias issue is difficult. |
|
| Back to top |
|
|
jim
Joined: 01 Aug 2009
Posts: 13
|
| Posted: Mon Jul 05, 2010 9:46 am Post subject: |
|
|
| Really good stuff, DSMok1. |
|
| Back to top |
|
|
DSMok1
Joined: 05 Aug 2009
Posts: 610
Location: Where the wind comes sweeping down the plains
|
| Posted: Tue Jul 06, 2010 4:42 pm Post subject: |
|
|
A few updates:
I ran some year-to-year correlations to estimate the stability of WS/48. I controlled the players used to minimize changes in roles--I used players that had similar MPG, total minutes, and games played in subsequent years. (I was basically attempting to simulate a split-half correlation test, like those used at 525600 Minutes: How do You Measure a Player-in a Year) This estimate of stability can then be used to generate a regression equation, like Tom Tango has done for baseball: r=x/(x+n), where x is the number of minutes, r is the correlation, and n is the number of minutes of baseline/prior expectation to use.
I ended up with 407 year over year data points that fulfilled my criteria. I simply ran a correlation on the 407 points WS/48 points, and also looked at what the average number of minutes in the two years was: 2256 minutes, correlation of 0.7424.
Using Tango's equation (http://www.insidethebook.com/ee/index.php/site/comments/pre_introducing_batted_ball_fip_part_2/, that yields a regression equation for WS/48 of
Regression Rate = 782/(n+782)
where n is the number of minutes. Since we are using year-to-year correlations to approximate this, I rounded this down to 750:
Use 750 minutes of the Bayesian Prior to regress WS/48
Note, I may be doing this all wrong.... but that's why I'm posting here, for review. I'm not totally certain that Tango's regression equation is applicable here.
Anyway, it appears that the use of 200 minutes for regressing WS/48 was low. After correcting for that, here are the top 40 players from last year, in regressed WS/48:
| Code: | Rk Player Age Tm G MP PER WS/48 Regressed WS/48
1 LeBron James 25 CLE 76 2966 31.1 0.299 0.277
2 Kevin Durant 21 OKC 82 3239 26.2 0.238 0.223
3 Dwight Howard 24 ORL 82 2843 24.0 0.223 0.214
4 Pau Gasol 29 LAL 65 2403 22.9 0.220 0.207
5 Dwyane Wade 28 MIA 77 2792 28.0 0.224 0.207
6 Tim Duncan 33 SAS 78 2438 24.7 0.215 0.199
7 Manu Ginobili 32 SAS 75 2150 22.5 0.216 0.196
8 Dirk Nowitzki 31 DAL 81 3039 22.9 0.194 0.185
9 Nene Hilario 27 DEN 82 2755 18.9 0.188 0.179
10 Al Horford 23 ATL 81 2845 19.4 0.183 0.178
11 Amare Stoudemire 27 PHO 82 2838 22.6 0.181 0.176
12 Chris Paul 24 NOH 45 1712 23.7 0.204 0.175
13 Deron Williams 25 UTA 76 2802 20.6 0.177 0.175
14 Andrew Bynum 22 LAL 65 1977 20.2 0.188 0.175
15 Chauncey Billups 33 DEN 73 2490 20.2 0.182 0.174
16 Carlos Boozer 28 UTA 78 2673 21.3 0.178 0.174
17 Brandon Roy 25 POR 65 2419 21.3 0.180 0.174
18 Steve Nash 35 PHO 81 2660 21.6 0.178 0.172
19 Gerald Wallace 27 CHA 76 3119 18.3 0.177 0.172
20 Anderson Varejao 27 CLE 76 2166 15.8 0.179 0.171
21 Chris Bosh 25 TOR 70 2526 25.0 0.182 0.166
22 Kobe Bryant 31 LAL 73 2835 21.9 0.160 0.162
23 Andrei Kirilenko 28 UTA 58 1681 18.2 0.171 0.161
24 Kevin Garnett 33 BOS 69 2060 19.4 0.171 0.161
25 Paul Pierce 32 BOS 71 2411 18.2 0.165 0.160
26 J.J. Redick 25 ORL 82 1808 15.0 0.173 0.160
27 Vince Carter 33 ORL 75 2310 17.1 0.154 0.156
28 Josh Smith 24 ATL 81 2871 21.0 0.155 0.156
29 Rajon Rondo 23 BOS 81 2963 19.1 0.156 0.155
30 Marc Gasol 25 MEM 69 2469 19.3 0.164 0.152
31 Andrew Bogut 25 MIL 69 2229 20.7 0.161 0.152
32 Greg Oden 22 POR 21 502 23.1 0.214 0.151
33 David Lee 26 NYK 81 3019 22.2 0.163 0.151
34 Nicolas Batum 21 POR 37 918 17.3 0.181 0.150
35 Carmelo Anthony 25 DEN 69 2634 22.2 0.145 0.149
36 Chris Andersen 31 DEN 76 1692 15.9 0.166 0.148
37 Jason Kidd 36 DAL 80 2881 17.2 0.148 0.147
38 Paul Millsap 24 UTA 82 2277 16.7 0.151 0.147
39 LaMarcus Aldridge24 POR 78 2922 18.2 0.145 0.147
40 Zach Randolph 28 MEM 81 3051 21.2 0.153 0.146 |
I'll post a corrected aging curve sometime soon, as well as, hopefully, a projection system for Win Shares. (The idea is that the same methods will work for SPM, when I finally get the latest SPM regression done.) |
|
| Back to top |
|
|
BobboFitos
Joined: 21 Feb 2009
Posts: 199
Location: Cambridge, MA
|
| Posted: Sat Aug 28, 2010 12:49 am Post subject: |
|
|
Strange bump maybe, but I've been thinking a ton about aging curves lately. It would be interesting if, rather then lumping "all nba players" together, to break up various player types. The reason for this is certain guys who buck the trend (Nash/Stockton, for example) are/were pass first, insanely good shooters. It seems their games didn't decline at all.
There are a bunch of player classification, but even a simple one based on height first could perhaps show different peaks/etc...
_________________
-Rob |
|
| Back to top |
|
|
Manchvegasbob
Joined: 03 Aug 2008
Posts: 52
|
| Posted: Thu Sep 30, 2010 7:31 pm Post subject: Aging Curve for Garnett |
|
|
I was looking to see what was available for discussion on aging curves and was glad to this thread bumped up.
I had an article posted Forecasting Garnett: 2011 and Beyond and got a kick out of the classic parabolic curve.
I recalled that this 2nd order polynomial predictor show's up in the classic (see NBAstuffer.com)
| Quote: |
Trade Value= (AV-Y)2(Y+1)AV/190 + AV*Y2/13
where AV is Approximate Value Y= 27-0.75*Age. A player's Y factor represents an estimate of how many seasons he has left to play and is always assumed to be at least one and a half years. |
Anyway, I came up with the following best-fit regression curves using minutes played and PER versus age and WS/48.
 [/url] [/url]
I can provide some of the raw data if you are interested - I wasn't encouraged by the results for Garnett, but word out of the first few days of training camp is encouraging that he may be rejuvenated, but not many of the MVPs listed above have been able to turn things around after the decline sets in.
Compared to the Heat, the aging Celtics are considered an afterthought. So these type of aging curves are particularly interesting in assessing what's left in the tank for Garnett, Ray Allen and Shaq and perhaps Pierce and JO as well. I just think Garnett and Allen are oddities of nature with regard to how fit they are, that either of them could have a renaissance season. However, Shaq has proven he's done. |
|
| Back to top |
|
|
|
|
You cannot post new topics in this forum
You cannot reply to topics in this forum
You cannot edit your posts in this forum
You cannot delete your posts in this forum
You cannot vote in polls in this forum
|
Powered by phpBB © 2001, 2005 phpBB Group
|

