 |
APBRmetrics
The statistical revolution will not be televised.
|
| View previous topic :: View next topic |
| Author |
Message |
DSMok1
Joined: 05 Aug 2009
Posts: 611
Location: Where the wind comes sweeping down the plains
|
 Posted: Thu May 13, 2010 4:17 pm Post subject: Draft Pick Value Posted: Thu May 13, 2010 4:17 pm Post subject: Draft Pick Value |
 |
|
Justin Kubatko worked up a method for valuing draft picks at the Basketball Reference Blog last year, and I thought I would revise and expand upon it.
I went through every draft since the 1979 draft (that had 4 years completed) and compiled each player's win shares. However, I felt win shares didn't accurately reflect the player's value to the organization, so I implemented a replacement level of 0.025 WS/48. (That equals 10.25 wins per season). Then I calculated the Win Shares above Replacement for each player drafted, over their first 4 years.
Similar to Justin, I fitted a logarithmic curve to the data--but I didn't feel the curve accurately reflected the linearization of the second round, so I added a linear component as well. This I fitted using weighted least-squares regression, according to another curve estimating the standard deviation of each draft pick.
Here are the results:
WS above Replacement Estimate: y = -5.82652 * ln(0.83085*x - 0.02517) + 0.05883 * x + 20.10883
(R^2 = .922)
Std. Dev. Estimate: y = -1.3018 * ln(0.9812*x - 0.0089) - 0.0016 * x + 7.7374
(R^2 = 0.5)
The resulting graph: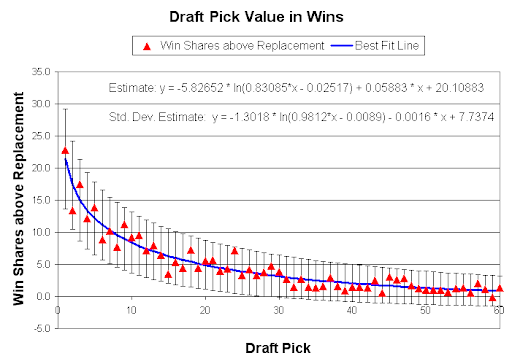
The error bars are equal to +/- 1 standard deviation.
And here are the results in tabular form:
| Code: | Pick WS over Rep. Stdev
1 21.43 7.77
2 17.36 6.86
3 15.02 6.33
4 13.39 5.95
5 12.14 5.66
6 11.13 5.42
7 10.29 5.22
8 9.57 5.04
9 8.94 4.89
10 8.38 4.75
11 7.88 4.62
12 7.43 4.51
13 7.02 4.40
14 6.65 4.31
15 6.30 4.21
16 5.99 4.13
17 5.69 4.05
18 5.42 3.97
19 5.16 3.90
20 4.92 3.83
21 4.69 3.77
22 4.48 3.70
23 4.28 3.64
24 4.09 3.59
25 3.91 3.53
26 3.74 3.48
27 3.58 3.43
28 3.43 3.38
29 3.28 3.33
30 3.14 3.29
31 3.01 3.24
32 2.88 3.20
33 2.76 3.16
34 2.65 3.12
35 2.54 3.08
36 2.43 3.04
37 2.33 3.00
38 2.23 2.97
39 2.14 2.93
40 2.05 2.90
41 1.97 2.86
42 1.89 2.83
43 1.81 2.80
44 1.73 2.77
45 1.66 2.74
46 1.59 2.71
47 1.52 2.68
48 1.46 2.65
49 1.40 2.62
50 1.34 2.59
51 1.28 2.56
52 1.23 2.54
53 1.18 2.51
54 1.13 2.48
55 1.08 2.46
56 1.03 2.43
57 0.99 2.41
58 0.95 2.38
59 0.90 2.36
60 0.87 2.34 |
Perhaps soon, this can be incorporated into a model that also looks at the value of the controlled salaries of the players on a rookie contract.
Last edited by DSMok1 on Thu May 20, 2010 7:43 am; edited 2 times in total |
|
| Back to top |
|
 |
DSMok1
Joined: 05 Aug 2009
Posts: 611
Location: Where the wind comes sweeping down the plains
|
| Posted: Fri May 14, 2010 9:55 am Post subject: |
|
|
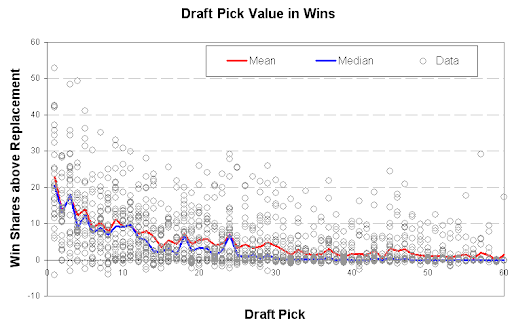
Another way to look at this is to evaluate the minimum, median, and maximum production from each pick over the 25 or so years. The following chart does that, including also the average/mean production from each pick as well.
At pick 45, the median production reaches 0; in other words, more than half of the players picked 45th or worse never produce any wins.
Note that the minimum wins actually drops as the picks get higher--the top picks get a bigger chance to prove themselves.
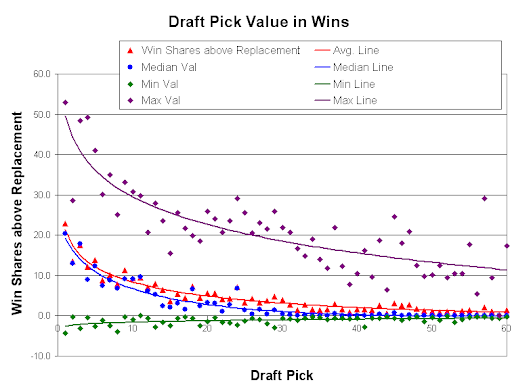
Basically, the reason #45 is worth more than #60 is there is more "upside". |
|
| Back to top |
|
|
DSMok1
Joined: 05 Aug 2009
Posts: 611
Location: Where the wind comes sweeping down the plains
|
| Posted: Fri May 14, 2010 10:19 am Post subject: |
|
|
And finally, here is a graph of the minimum, 25th percentile, median, 75th percentile, and maximum for each draft pick.
I only show the estimates, to avoid clutter.
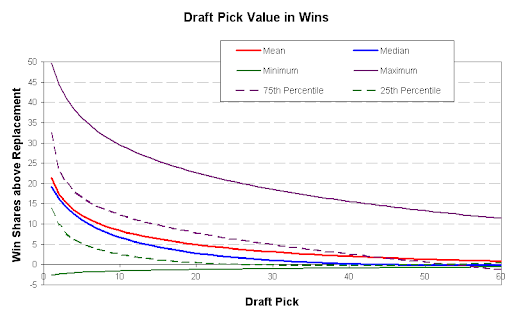
Below about pick 50, even the 75th percentile is at 0. In other words, don't expect them to play much! Also, many of the players in the 50s that produced did so after being stashed overseas for a while. I still measured their first 4 years in the NBA, for comparison's sake.
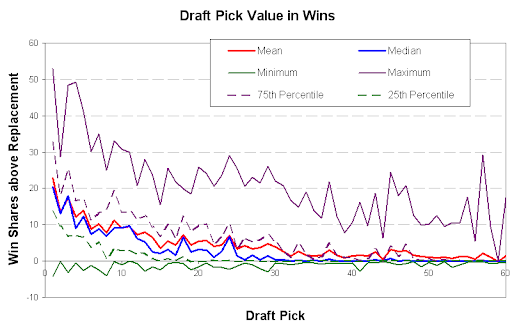
Here is the unsmoothed data:
 |
|
| Back to top |
|
|
DSMok1
Joined: 05 Aug 2009
Posts: 611
Location: Where the wind comes sweeping down the plains
|
| Posted: Fri May 14, 2010 10:34 am Post subject: |
|
|
One more visualization:
 |
|
| Back to top |
|
|
Mike G
Joined: 14 Jan 2005
Posts: 3628
Location: Hendersonville, NC
|
| Posted: Fri May 14, 2010 3:38 pm Post subject: |
|
|
Pretty cool. On the unsmoothed chart, odd-numbered picks are better than the previous picks.
| Quote: | | I felt win shares didn't accurately reflect the player's value to the organization, so I implemented a replacement level of 0.025 WS/48. (That equals 10.25 wins per season) |
The '93 Mavs won 11 games (Pyth 10) with a lot of literal 'replacement' types. But they also had Derek Harper, pretty close to his prime.
Wouldn't any expected wins be of value to the organization? We've never seen a team of pure replacements, but they'd probably win a game or 2, not 10.
Anyway, how does it affect the curves when you set RL to .010 or .000 ?
This year, Monta Ellis was .023, Corey Brewer .020. They led their teams in minutes. No value? Replaceable players?
In all, 25 players who got at least 500 minutes, 56 who got at least 100, were under .025 WS/48.
Even at .000 WS/48 replacement level, you have 46 guys appearing; 3 (all Nets) went over 1000 minutes.
_________________
`
36% of all statistics are wrong |
|
| Back to top |
|
|
DSMok1
Joined: 05 Aug 2009
Posts: 611
Location: Where the wind comes sweeping down the plains
|
| Posted: Fri May 14, 2010 4:28 pm Post subject: |
|
|
| Mike G wrote: | Pretty cool. On the unsmoothed chart, odd-numbered picks are better than the previous picks.
| Quote: | | I felt win shares didn't accurately reflect the player's value to the organization, so I implemented a replacement level of 0.025 WS/48. (That equals 10.25 wins per season) |
The '93 Mavs won 11 games (Pyth 10) with a lot of literal 'replacement' types. But they also had Derek Harper, pretty close to his prime.
Wouldn't any expected wins be of value to the organization? We've never seen a team of pure replacements, but they'd probably win a game or 2, not 10.
Anyway, how does it affect the curves when you set RL to .010 or .000 ?
This year, Monta Ellis was .023, Corey Brewer .020. They led their teams in minutes. No value? Replaceable players?
In all, 25 players who got at least 500 minutes, 56 who got at least 100, were under .025 WS/48.
Even at .000 WS/48 replacement level, you have 46 guys appearing; 3 (all Nets) went over 1000 minutes. |
Heh. I guess I should have explained that better. Basically, that's the threshold used by Kevin Pelton for his WARP data; I think it's reasonable. The concept is that players available for "minimal" cost would combine to win about 10 games. For instance, any players that are basically bench sitters for average teams. I'm sure you're familiar with Wins Above Replacement in baseball, where the concept is far more precisely articulated and developed.
Also, don't forget that all of these "player valuation" systems are fallible. I chose Win Shares simply because that's what Neil had used in his previous system. |
|
| Back to top |
|
|
DJE09
Joined: 05 May 2009
Posts: 148
|
| Posted: Tue May 18, 2010 6:13 am Post subject: |
|
|
I looked into this a little after Mike G did some posting about it early in the last off-season, and got patterns similar to what you were presenting. However, I got to asking some questions:
1. What impact the number of teams drafting has?
For example the Spurs famously took Tony Parker with the 28th pick in round 1 of the 2001 Draft, but before 1995 there weren't 28th picks in the first round, so instead of being one of the best teams in the NBA, it was one of the worst teams, making their second pick. Also if you look back into the 80s when they had draft until you drop drafts, you see the odd player like Manute Bol being drafted 97th in 1983, amongst a whole heap of people who never even got burn in the NBA. The issue of expansion over the last 30 years makes any sort of analysis based on draft position really messy.
2. What impact does team drafting have on the quality of picks at that position?
For instance, it doesn't take much to realise that the Spurs and the Clippers have significantly different drafting success. I realise we probably don't have enough data to do that sort of analysis. But it makes our data much noisier. Neil, did you look at this, or was it just a wishful phantom memory I have?
2a. A corrollary to this, is when a team has a much higher pick than usual / trades 'up' to get an earlier pick to get a particular player. Does that tend to produce an above average player? I can't think of many successful instances of this off the top of my head. But I can think of times when teams got themselves two high draft picks which didn't really seem to set them up (Chicago Chandler and Curry spring to mind)...
3. Draft Depth. It is pretty clear that in general the Second Pick is much harder to take than the First. By this I mean, if we "know" the best player, they're gone by the 2nd pick, and if we don't know who the best player is in a draft, often we don't really know who the second best player is either (Durant / Oden being the except that proves this rule). Further, historically on average picks 2-5 generate about the same amount of WS. I think that it could be argued that this is as much about teams, what they (think they) need most to be (more) competative as much as talent. This is infamous in the Bowie over Jordan selection. There is only a limited amount of great talent, so by the time you get to the 5th pick, they have all been taken. (LBJ et al providing evidence for this assertion). The depth varies from draft to draft adding to the noise.
I really don't know what to think about all this. I feel it is a chicken and egg thing. Are players that talented when they are drafted, or do they develop into the productive player because of the situation they ended up in? Would De Jaun Blair have worked at, say Golden State (I'll go out on a limb and say he'd have gotten injured)? Would Kobe have been a flop if he was drafted by New Jersey instead of Kerry Kittles (kittles played about twice as many minutes as Kobe in 1st 2 seasons, whilst being similarly productive on a per minute basis...)? It has to be a bit of both. But that is just opinion. Case and point Brandon Jennings. Lots of teams getting slammed for not picking him up, but perhaps his development is in part of being in Milwalkee. How do even begin to seperate out those factors? Would Tyreke Evans have had his rookie season at the Clippers or Memphis? Agent 0 is imfamously immature in his crediting his motivation for his success (sic) to his low draft position.
Oh, yeah, If you start post 1985 draft, positions 3 and 5 don't look all that hot ... |
|
| Back to top |
|
|
DSMok1
Joined: 05 Aug 2009
Posts: 611
Location: Where the wind comes sweeping down the plains
|
| Posted: Tue May 18, 2010 9:24 am Post subject: |
|
|
| DJE09 wrote: | I looked into this a little after Mike G did some posting about it early in the last off-season, and got patterns similar to what you were presenting. However, I got to asking some questions:
1. What impact the number of teams drafting has?
For example the Spurs famously took Tony Parker with the 28th pick in round 1 of the 2001 Draft, but before 1995 there weren't 28th picks in the first round, so instead of being one of the best teams in the NBA, it was one of the worst teams, making their second pick. Also if you look back into the 80s when they had draft until you drop drafts, you see the odd player like Manute Bol being drafted 97th in 1983, amongst a whole heap of people who never even got burn in the NBA. The issue of expansion over the last 30 years makes any sort of analysis based on draft position really messy. |
I would argue that, in general, teams are taking the best player available/the best player for their needs, so the issue of whether it is a good team drafting or a bad team drafting is moot. The issue of high schooler vs. college star is interesting. I only look at the years covered by a "rookie contract," so the college stars would have an advantage. However, isn't it also the case that in general the teams would have to pay close to market value after the first contract anyway, thus mitigating the advantages of having picked the player?
| DJE09 wrote: | 2. What impact does team drafting have on the quality of picks at that position?
For instance, it doesn't take much to realise that the Spurs and the Clippers have significantly different drafting success. I realise we probably don't have enough data to do that sort of analysis. But it makes our data much noisier. Neil, did you look at this, or was it just a wishful phantom memory I have? |
We know this sort of thing after the fact, but I don't know how much of an effect we could have assumed before the draft. In other words--were the Spurs good or lucky? Okay, so I think the Clippers were bad at drafting...
Here's what happened, though: | Code: | WS over Replacement
Team Picks Expected Actual Ratio
NOH 6 30 74 246%
PHO 69 245 375 153%
SAS 53 210 320 153%
SDC 8 56 83 149%
DET 53 263 354 135%
LAL 47 190 253 134%
CLE 61 282 373 132%
UTA 55 233 300 128%
MIL 54 260 318 122%
MEM 12 58 69 117%
KCK 15 72 83 116%
SEA 65 274 309 113%
HOU 58 264 280 106%
MIA 38 162 166 103%
NYK 55 251 258 102%
IND 60 271 277 102%
GSW 73 361 369 102%
POR 68 273 275 101%
CHH 24 154 149 97%
CHI 80 419 389 93%
MIN 38 192 177 92%
SAC 48 232 206 89%
BOS 52 257 226 88%
DAL 71 343 298 87%
WSB 52 209 182 87%
NJN 55 321 279 87%
ORL 39 238 206 86%
PHI 65 303 255 84%
DEN 62 288 228 79%
VAN 13 106 81 77%
ATL 71 302 225 74%
TOR 23 161 114 71%
WAS 18 94 54 58%
LAC 52 364 176 48%
CHA 6 55 22 40%
NOK 3 16 1 9% |
| DJE09 wrote: | | 2a. A corrollary to this, is when a team has a much higher pick than usual / trades 'up' to get an earlier pick to get a particular player. Does that tend to produce an above average player? I can't think of many successful instances of this off the top of my head. But I can think of times when teams got themselves two high draft picks which didn't really seem to set them up (Chicago Chandler and Curry spring to mind)... |
I haven't looked into that. I rather doubt it's significant.
| DJE09 wrote: | | 3. Draft Depth. It is pretty clear that in general the Second Pick is much harder to take than the First. By this I mean, if we "know" the best player, they're gone by the 2nd pick, and if we don't know who the best player is in a draft, often we don't really know who the second best player is either (Durant / Oden being the except that proves this rule). Further, historically on average picks 2-5 generate about the same amount of WS. I think that it could be argued that this is as much about teams, what they (think they) need most to be (more) competative as much as talent. This is infamous in the Bowie over Jordan selection. There is only a limited amount of great talent, so by the time you get to the 5th pick, they have all been taken. (LBJ et al providing evidence for this assertion). The depth varies from draft to draft adding to the noise. |
I think that in most cases, there is a fairly steady continuum of talent. But it's only known after the fact. The reversal of #2 and #3 is more likely because of random scatter. And Len Bias and Jay Williams not turning out. I don't know why there was a consistent bias.
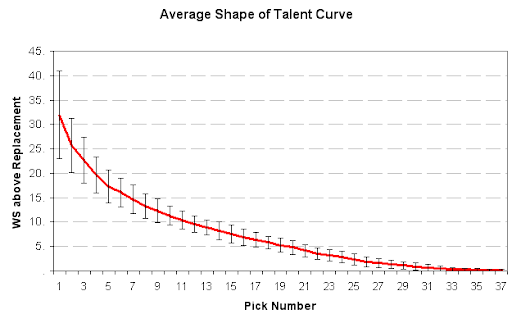
Here is a graph of the depth of each draft evaluated:
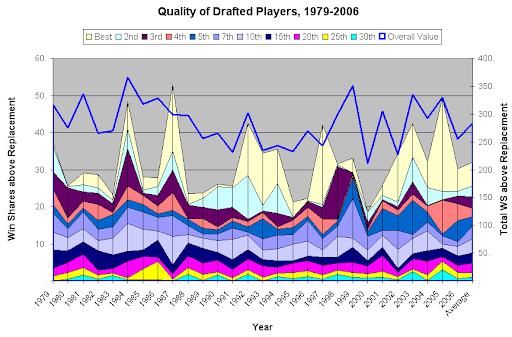
And here is the average shape of talent, with +/- 1 stdev error bars:
| DJE09 wrote: | I really don't know what to think about all this. I feel it is a chicken and egg thing. Are players that talented when they are drafted, or do they develop into the productive player because of the situation they ended up in? Would De Jaun Blair have worked at, say Golden State (I'll go out on a limb and say he'd have gotten injured)? Would Kobe have been a flop if he was drafted by New Jersey instead of Kerry Kittles (kittles played about twice as many minutes as Kobe in 1st 2 seasons, whilst being similarly productive on a per minute basis...)? It has to be a bit of both. But that is just opinion. Case and point Brandon Jennings. Lots of teams getting slammed for not picking him up, but perhaps his development is in part of being in Milwalkee. How do even begin to separate out those factors? Would Tyreke Evans have had his rookie season at the Clippers or Memphis? Agent 0 is imfamously immature in his crediting his motivation for his success (sic) to his low draft position.
Oh, yeah, If you start post 1985 draft, positions 3 and 5 don't look all that hot ... |
From what I have shown, the shape of talent curve varies widely from draft to draft. However, no one really knows it beforehand. (Perhaps they can guess--this year, they say that the mid-range talent is very deep.)
I suppose some of the difference in how a player performed depended on situation. However, I think that is often overrated. I believe most of what happens with the player depends on the player. If they are good enough, work hard enough, the team will get them on the floor. And all teams have a strong incentive to develop their players; I don't believe there is THAT big of a difference between teams. |
|
| Back to top |
|
|
Mike G
Joined: 14 Jan 2005
Posts: 3628
Location: Hendersonville, NC
|
| Posted: Tue May 18, 2010 10:02 am Post subject: |
|
|
Again, nice graphs!
The one labeled "Quality of Drafted Players" (and introduced as " a graph of the depth of each draft evaluated: ") -- can you tell us what that represents?
Is it still the first four years of players' WS?
And the (light yellow) high peak from the '84 draft is Jordan's 1st 4 years, while that of '87 is Robinson?
If so, then I'll mention that the first 4 years of the '85 draft vastly understates that group's eventual totals. They were 2nd to the previous year in career WS, I believe. But they were (I guess) nothing special thru 4 years.
_________________
`
36% of all statistics are wrong |
|
| Back to top |
|
|
DSMok1
Joined: 05 Aug 2009
Posts: 611
Location: Where the wind comes sweeping down the plains
|
| Posted: Tue May 18, 2010 10:46 am Post subject: |
|
|
| Mike G wrote: | Again, nice graphs!
The one labeled "Quality of Drafted Players" (and introduced as " a graph of the depth of each draft evaluated: ") -- can you tell us what that represents?
Is it still the first four years of players' WS?
And the (light yellow) high peak from the '84 draft is Jordan's 1st 4 years, while that of '87 is Robinson?
If so, then I'll mention that the first 4 years of the '85 draft vastly understates that group's eventual totals. They were 2nd to the previous year in career WS, I believe. But they were (I guess) nothing special thru 4 years. |
Correct on all counts. However, wouldn't you say that the value to the team (in general) is from their first few years (after which the team pays close to market value for the player)?
In other words--the value of the contract to the team comes from not having to pay the player what they are worth on a true open market, like in baseball. If the average win costs $2.5 million dollars (the approximate payroll, divided by 31 (wins above replacement)*30), then the value of any player's contract is about their value in wins*2.5 million - contract price.
Obviously, the free agent market cost is above that price, primarily because teams have more of their (CBA defined) player money because of restricting the younger players' payrolls. Phil Birnbaum discussed the price for wins structure in a series of posts about baseball: http://sabermetricresearch.blogspot.com/2010/04/why-teams-pay-equal-prices-for-free_28.html#links, and Dan Rosenbaum wrote a journal article about this subject as well: http://web.archive.org/web/20071027155325/http://www.uncg.edu/bae/people/rosenbaum/youngnba1.pdf.
And this is the direction I want to research. What is the ACTUAL value of the higher draft picks, not in terms of wins, but in terms of the money saved by getting the wins at a controlled price?
Here's my first crack at it. Second rounders get really fuzzy because of their variable contracts.
| Code: | Pick Value of Wins 4 Yr Contract Marginal Value
1 $53,570,000 $20,041,804 $33,530,000
2 $43,390,000 $17,936,256 $25,450,000
3 $37,560,000 $16,115,130 $21,440,000
4 $33,480,000 $14,532,895 $18,950,000
5 $30,350,000 $13,166,778 $17,180,000
6 $27,830,000 $11,962,023 $15,870,000
7 $25,720,000 $10,925,078 $14,790,000
8 $23,910,000 $10,013,568 $13,900,000
9 $22,340,000 $9,209,319 $13,130,000
10 $20,950,000 $8,750,603 $12,200,000
11 $19,700,000 $8,419,293 $11,280,000
12 $18,580,000 $8,097,008 $10,480,000
13 $17,560,000 $7,785,917 $9,770,000
14 $16,620,000 $7,487,751 $9,130,000
15 $15,760,000 $7,199,173 $8,560,000
16 $14,970,000 $6,841,065 $8,130,000
17 $14,230,000 $6,501,828 $7,730,000
18 $13,540,000 $6,179,628 $7,360,000
19 $12,900,000 $5,904,060 $7,000,000
20 $12,300,000 $5,670,647 $6,630,000
21 $11,730,000 $5,507,633 $6,220,000
22 $11,200,000 $5,349,948 $5,850,000
23 $10,700,000 $5,196,317 $5,500,000
24 $10,230,000 $5,045,667 $5,180,000
25 $9,780,000 $4,899,204 $4,880,000
26 $9,350,000 $4,739,066 $4,610,000
27 $8,950,000 $4,603,216 $4,350,000
28 $8,570,000 $4,575,824 $3,990,000
29 $8,200,000 $4,542,628 $3,660,000
30 $7,860,000 $4,509,812 $3,350,000 |
No wonder the top pick in the draft rarely gets traded! |
|
| Back to top |
|
|
DSMok1
Joined: 05 Aug 2009
Posts: 611
Location: Where the wind comes sweeping down the plains
|
| Posted: Tue May 18, 2010 10:53 am Post subject: |
|
|
The top 10 players during their first 4 years in the league for 1984 and 1985:
| Code: | 1984
Pick Rnk Team Player WSaRP, first 4 Yrs
3 1 CHI Michael Jordan 48.4
5 2 PHI Charles Barkley 41.1
1 3 HOU Hakeem Olajuwon 35.6
16 4 UTA John Stockton 25.6
4 5 DAL Sam Perkins 21.9
18 6 IND Vern Fleming 19.9
9 7 KCK Otis Thorpe 19.8
7 8 SAS Alvin Robertson 17.5
46 9 POR Jerome Kersey 17.1
11 10 ATL Kevin Willis 15.6
1985
Pick Rnk Team Player WSaRP, first 4 Yrs
13 1 UTA Karl Malone 27.9
45 2 CLE Hot Rod Williams 24.5
23 3 LAL A.C. Green 23.6
24 4 POR Terry Porter 23.0
1 5 NYK Patrick Ewing 20.6
7 6 GSW Chris Mullin 19.1
4 7 SEA Xavier McDaniel 18.5
2 8 IND Wayman Tisdale 15.6
18 9 DET Joe Dumars 15.3
9 10 CLE Charles Oakley 14.0 |
|
|
| Back to top |
|
|
Carlos
Joined: 21 Jan 2005
Posts: 64
Location: Montevideo, Uruguay
|
| Posted: Tue May 18, 2010 11:01 am Post subject: |
|
|
| VERY nice, but it would be interesting to see this data in terms of probability of drafting a player with x number of Winshares (from 5 to 10, from 10 to 15, etc.) at each spot. I remember seeing a study in 82games and it was somewhat striking how high the probability of drafting a bench player was after the 6th pick. My impression has always been that a lot of the value of the first 5 picks is that is very unlikely to do really badly (Darko badly) that high. |
|
| Back to top |
|
|
DSMok1
Joined: 05 Aug 2009
Posts: 611
Location: Where the wind comes sweeping down the plains
|
| Posted: Tue May 18, 2010 11:32 am Post subject: |
|
|
| Carlos wrote: | | VERY nice, but it would be interesting to see this data in terms of probability of drafting a player with x number of Winshares (from 5 to 10, from 10 to 15, etc.) at each spot. I remember seeing a study in 82games and it was somewhat striking how high the probability of drafting a bench player was after the 6th pick. My impression has always been that a lot of the value of the first 5 picks is that is very unlikely to do really badly (Darko badly) that high. |
Hence my usage of the mean and median, along with percentiles up in the graphs higher up.
Or this:
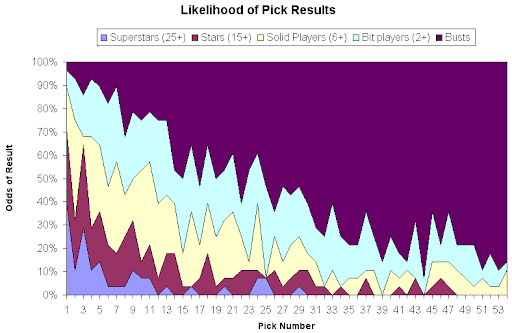
EDIT: the numbers are WS above Replacement thresholds. |
|
| Back to top |
|
|
Carlos
Joined: 21 Jan 2005
Posts: 64
Location: Montevideo, Uruguay
|
| Posted: Tue May 18, 2010 12:04 pm Post subject: |
|
|
| Great. I had noticed the mean and median thing, but I think this shows more clearly the variation in value. After the fifth pick, you have a quite substantial chance of picking a bit player or a bust. Picking in the top 3 isn't a sure thing either, but your chances of picking a solid player or better are really good. |
|
| Back to top |
|
|
Mike G
Joined: 14 Jan 2005
Posts: 3628
Location: Hendersonville, NC
|
| Posted: Tue May 18, 2010 1:37 pm Post subject: |
|
|
Looking at these charts, I still get the feeling there's an artificial horizon, beneath which we aren't seeing it all. That would be, of course, the .025 subtracted from everyone's WS/48 rates.
Losing more than half of their WS to the replacement threshold, during their 1st 4 years: Stackhouse, Jim Jackson, Griffith, Bradley, JWill, Hughes, Mark West, Delk, Bobby Jackson, Longley, Sealy, Chris Dudley, Christie, Skiles, Hawes, House, ...
I haven't looked up their draft positions, but I make a guess that they all played for bad-to-terrible teams early in their careers. Yet they all turned out respectably, after getting to better teams.
Some confounding conditions:
- Better rookies tend to start with bad teams initially.
- Players from bad teams are slammed by WS.
- The replacement threshold reduces their already meager WS even further.
So I repeat my initial question: How do these charts and tables look when RT = 0 ? or RT = .01 ?
_________________
`
36% of all statistics are wrong |
|
| Back to top |
|
|
|
|
You cannot post new topics in this forum
You cannot reply to topics in this forum
You cannot edit your posts in this forum
You cannot delete your posts in this forum
You cannot vote in polls in this forum
|
Powered by phpBB © 2001, 2005 phpBB Group
|

