 |
APBRmetrics
The statistical revolution will not be televised.
|
| View previous topic :: View next topic |
| Author |
Message |
Joe
Joined: 27 Sep 2009
Posts: 94
Location: Long Island, NY
|
 Posted: Thu May 20, 2010 8:30 am Post subject: Posted: Thu May 20, 2010 8:30 am Post subject: |
 |
|
| DSMok1 wrote: | | Joe wrote: |
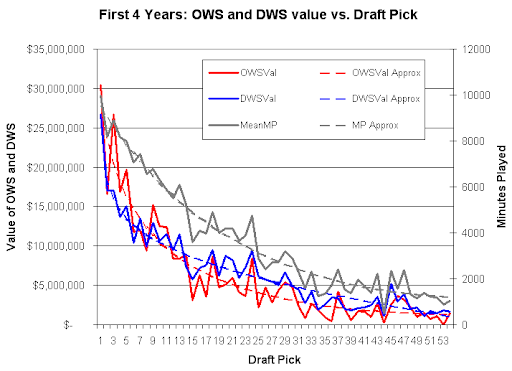
Can you run this for OWS and DWS separately as well? |
Yes, I can. Something to note--more of the "rookie" wins come from defense than from offense; this is possibly related to the fact there is a significant team adjustment on defensive win shares. |
Yeah, I'm aware of the adjustment, which is why I wanted to see how it affects things when split.
_________________
http://www.hoopdata.com |
|
| Back to top |
|
 |
DSMok1
Joined: 05 Aug 2009
Posts: 611
Location: Where the wind comes sweeping down the plains
|
|
| Back to top |
|
|
DSMok1
Joined: 05 Aug 2009
Posts: 611
Location: Where the wind comes sweeping down the plains
|
| Posted: Thu May 20, 2010 9:18 am Post subject: |
|
|
Here's a start, Joe:
| Code: | OWS Value DWS Value Actual Cost Marginal Value
$28,673,949 $26,692,346 $20,041,804 $35,320,000
$23,662,943 $18,213,328 $17,936,256 $23,940,000
$20,427,147 $15,946,985 $16,115,130 $20,260,000
$18,055,336 $14,554,302 $14,532,895 $18,080,000
$16,196,425 $13,533,293 $13,166,778 $16,560,000
$14,677,595 $12,719,340 $11,962,023 $15,430,000
$13,400,909 $12,037,599 $10,925,078 $14,510,000
$12,305,457 $11,447,661 $10,013,568 $13,740,000
$11,350,766 $10,925,209 $9,209,319 $13,070,000
$10,508,569 $10,454,468 $8,750,603 $12,210,000
$9,758,341 $10,024,619 $8,419,293 $11,360,000
$9,084,709 $9,627,921 $8,097,008 $10,620,000
$8,475,858 $9,258,639 $7,785,917 $9,950,000
$7,922,513 $8,912,412 $7,487,751 $9,350,000
$7,417,257 $8,585,842 $7,199,173 $8,800,000
$6,954,069 $8,276,229 $6,841,065 $8,390,000
$6,527,990 $7,981,397 $6,501,828 $8,010,000
$6,134,893 $7,699,562 $6,179,628 $7,650,000
$5,771,299 $7,429,243 $5,904,060 $7,300,000
$5,434,254 $7,169,203 $5,670,647 $6,930,000
$5,121,228 $6,918,389 $5,507,633 $6,530,000
$4,830,034 $6,675,907 $5,349,948 $6,160,000
$4,558,772 $6,440,982 $5,196,317 $5,800,000
$4,305,779 $6,212,947 $5,045,667 $5,470,000
$4,069,592 $5,991,215 $4,899,204 $5,160,000
$3,848,917 $5,775,276 $4,739,066 $4,890,000
$3,642,605 $5,564,675 $4,603,216 $4,600,000
$3,449,628 $5,359,011 $4,575,824 $4,230,000
$3,269,067 $5,157,925 $4,542,628 $3,880,000
$3,100,093 $4,961,099 $4,509,812 $3,550,000 |
I didn't round the first numbers, obviously! |
|
| Back to top |
|
|
DSMok1
Joined: 05 Aug 2009
Posts: 611
Location: Where the wind comes sweeping down the plains
|
| Posted: Thu May 20, 2010 9:46 am Post subject: |
|
|
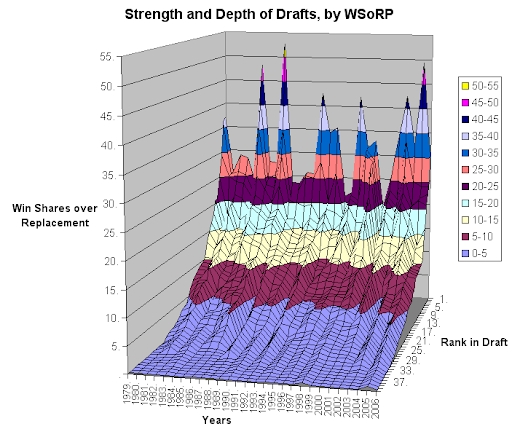
Here is another graph of the historical depth of drafts--hard to read, I know, but rather cool anyway. 
 |
|
| Back to top |
|
|
Joe
Joined: 27 Sep 2009
Posts: 94
Location: Long Island, NY
|
| Posted: Thu May 20, 2010 10:03 am Post subject: |
|
|
Seeing how DWS has a much smaller distribution than OWS (I'm fairly certain this applies both for rookie contracts and the league as a whole), shouldn't replacement level value for DWS be higher than OWS? That chart makes me wonder if perhaps DWS and OWS should have their replacement level values calculated independently and then have marginal value added back together based on the independent replacement level values to calculate total marginal value for WS.
If you applied that 0.0125 DWS/48 threshold as replacement level for the entire league, how many players actually come out below replacement level? And as compared to OWS?
I may be off base, but seeing those splits really makes me pause about setting the replacement level for DWS/OWS at the same number (an equal split of the replacement level for WS), though there certainly may be something I'm missing, making me sound like an idiot right now. 
edit: I'm also assuming you indeed did split the 0.025 replacement level equally for OWS/DWS, which I think is implied seeing how you didn't state otherwise. If you did do something different, then nevermind my rambling.
_________________
http://www.hoopdata.com |
|
| Back to top |
|
|
DSMok1
Joined: 05 Aug 2009
Posts: 611
Location: Where the wind comes sweeping down the plains
|
| Posted: Thu May 20, 2010 11:14 am Post subject: |
|
|
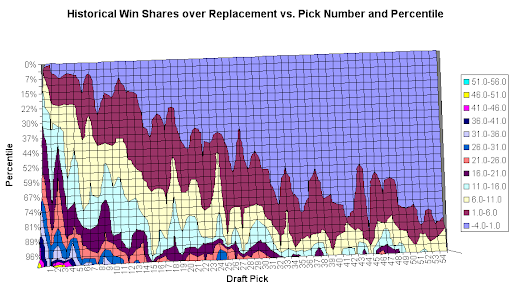
Another chart looking at the expected contribution percentiles for each pick (down to #54).
 |
|
| Back to top |
|
|
DSMok1
Joined: 05 Aug 2009
Posts: 611
Location: Where the wind comes sweeping down the plains
|
| Posted: Thu May 20, 2010 12:11 pm Post subject: |
|
|
| Joe wrote: | Seeing how DWS has a much smaller distribution than OWS (I'm fairly certain this applies both for rookie contracts and the league as a whole), shouldn't replacement level value for DWS be higher than OWS? That chart makes me wonder if perhaps DWS and OWS should have their replacement level values calculated independently and then have marginal value added back together based on the independent replacement level values to calculate total marginal value for WS.
If you applied that 0.0125 DWS/48 threshold as replacement level for the entire league, how many players actually come out below replacement level? And as compared to OWS?
I may be off base, but seeing those splits really makes me pause about setting the replacement level for DWS/OWS at the same number (an equal split of the replacement level for WS), though there certainly may be something I'm missing, making me sound like an idiot right now.
edit: I'm also assuming you indeed did split the 0.025 replacement level equally for OWS/DWS, which I think is implied seeing how you didn't state otherwise. If you did do something different, then nevermind my rambling. |
I've been pondering this, and I don't think that the replacement levels need to be split and calculated separately. The replacement team is defined as 10 wins. The OWS will have more players below replacement level, purely because we have more precise offensive stats and can calculate the player's actual contributions more accurately. Conversely, the DWS calculation is more ambiguous and has more of a "regressed" look to it--there will be fewer players as far from the league average. I don't think that means the replacement level needs to be changed; I think it simply means that we cannot differentiate players as well on the defensive side of the ball. |
|
| Back to top |
|
|
Joe
Joined: 27 Sep 2009
Posts: 94
Location: Long Island, NY
|
| Posted: Thu May 20, 2010 12:23 pm Post subject: |
|
|
| DSMok1 wrote: | | Joe wrote: | Seeing how DWS has a much smaller distribution than OWS (I'm fairly certain this applies both for rookie contracts and the league as a whole), shouldn't replacement level value for DWS be higher than OWS? That chart makes me wonder if perhaps DWS and OWS should have their replacement level values calculated independently and then have marginal value added back together based on the independent replacement level values to calculate total marginal value for WS.
If you applied that 0.0125 DWS/48 threshold as replacement level for the entire league, how many players actually come out below replacement level? And as compared to OWS?
I may be off base, but seeing those splits really makes me pause about setting the replacement level for DWS/OWS at the same number (an equal split of the replacement level for WS), though there certainly may be something I'm missing, making me sound like an idiot right now.
edit: I'm also assuming you indeed did split the 0.025 replacement level equally for OWS/DWS, which I think is implied seeing how you didn't state otherwise. If you did do something different, then nevermind my rambling. |
I've been pondering this, and I don't think that the replacement levels need to be split and calculated separately. The replacement team is defined as 10 wins. The OWS will have more players below replacement level, purely because we have more precise offensive stats and can calculate the player's actual contributions more accurately. Conversely, the DWS calculation is more ambiguous and has more of a "regressed" look to it--there will be fewer players as far from the league average. I don't think that means the replacement level needs to be changed; I think it simply means that we cannot differentiate players as well on the defensive side of the ball. |
That certainly may be part of it, but it doesn't exactly clash with common sense for the difference in distribution to actually be partially true. The notion that differentiation in defensive performance is less than offensive performance isn't exactly a radical notion by basketball evaluation standards. Further, if the stats are not exact enough, isn't there a good argument for replacement level not being exact enough as well? Replacement level is typically viewed as something like the 80th percentile of player performance in most sports, right? So if 99% of players are playing over the defensive replacement level in this methodology, that doesn't really make much sense, does it? Otherwise what we're talking about isn't really replacement level, seeing how everyone is adding wins.
I'm making an assumption here about where the replacement threshold is actually falling with DWS, as I don't have access to the entire league numbers.
_________________
http://www.hoopdata.com |
|
| Back to top |
|
|
BobboFitos
Joined: 21 Feb 2009
Posts: 201
Location: Cambridge, MA
|
| Posted: Thu May 20, 2010 1:12 pm Post subject: |
|
|
This thread has brought up a few other thread starters, like redefining exactly what we all mean by replacement level. Perhaps it's best served to split it up, so that we can delve a little further into the value of a draft pick here - all the while exploring the floor of a team of replacements in a new thread?..
_________________
http://pointsperpossession.com/
@PPPBasketball |
|
| Back to top |
|
|
DSMok1
Joined: 05 Aug 2009
Posts: 611
Location: Where the wind comes sweeping down the plains
|
| Posted: Thu May 20, 2010 4:55 pm Post subject: |
|
|
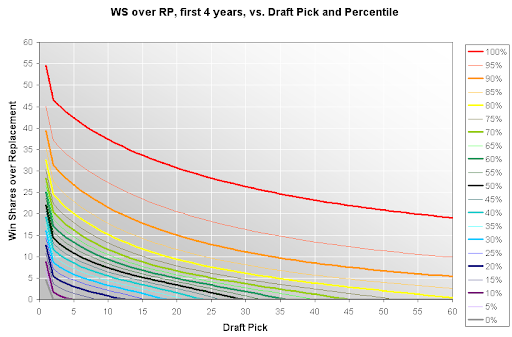
My first attempt at smoothing the WSoRP vs. Draft Pick vs. Likelihood surface:
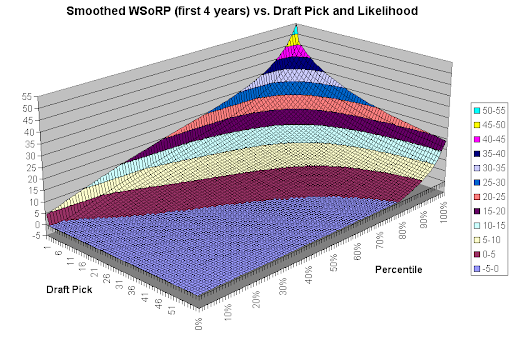
The equation to get to that is REALLY messy. |
|
| Back to top |
|
|
DSMok1
Joined: 05 Aug 2009
Posts: 611
Location: Where the wind comes sweeping down the plains
|
| Posted: Fri May 21, 2010 9:07 am Post subject: |
|
|
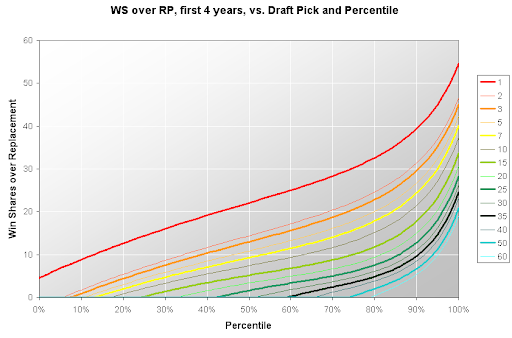
A 2-D version of the above graph:

I went back historically and estimated thresholds for various types of players.
Over 4 years, such as this evaluation, here are the levels:
30+ WSoRP: Superstar (~15 in the league in any 4 year span)
20-30 WSoRP: Star (~30 in the league over a 4 year span)
12-20 WSoRP: Solid Starter (~60)
5-12 WSoRP: Role Player
0-5 WSoRP: Bit Player
<0 WSoRP: Worthless Player |
|
| Back to top |
|
|
DSMok1
Joined: 05 Aug 2009
Posts: 611
Location: Where the wind comes sweeping down the plains
|
| Posted: Fri May 21, 2010 10:21 am Post subject: |
|
|
Continuing to explore visualization options:
 |
|
| Back to top |
|
|
gabefarkas
Joined: 31 Dec 2004
Posts: 1313
Location: Durham, NC
|
| Posted: Fri May 21, 2010 12:42 pm Post subject: |
|
|
| DJE09 wrote: | | before 1995 there weren't 28th picks in the first round, so instead of being one of the best teams in the NBA, it was one of the worst teams, making their second pick. Also if you look back into the 80s when they had draft until you drop drafts, you see the odd player like Manute Bol being drafted 97th in 1983, amongst a whole heap of people who never even got burn in the NBA. The issue of expansion over the last 30 years makes any sort of analysis based on draft position really messy. |
(I know I'm a little late with this reply...)
I think the talent pool expanded in line with the number of picks. At least, I think we have to assume that it did. In other words, those late-first-round foreign gems that teams started grabbing in the late 90's weren't even on the radar screen in the mid-80's. Or if they were, there were fewer of them and there were also fewer American-born players.
To me, the 1996 draft was the first one where you really see an influx of foreign talent, and even a few creeping into the first round (#14 Peja Stojakovic, #20 Zydrunas Ilgauskas, #23 Efthimi Rentzias, #25 Martin Muursepp). The 1998 draft was when the floodgates burst open (Dirk, Rasho Nesterovic, Mirsad Turkcan, Vladimir Stepania, Bruno Sundov).
Before '96, there you had players like: George Zidek (born in Czech Republic, but attended UCLA), Dragan Tarlac, Dejan Bodiroga, Constantin Popa (born in Romania, attended Miami), Aurelijius Zukauskas, Yinka Dare, Andrei Fetisov, William Njoku, Zeljko Rebraca, Gheorghe Muresan, Marcelo Nicola, Sasha Danilovic, Zan Tabak, Toni Kukoc, Stefano Rusconi, Vlade Divac, Dino Radja, Jose Vargas, Jorge Gonzalez, Rik Smits, Song Tao, Jose Antonio Montero, Sarunas Marciulionis, Franjo Arapovic, Georgi Glouchkov, Arvydas Sabonis, Drazen Petrovic, Stojko Vrankovic, Uwe Blab, Detlef Schrempf, Manute Bol, Milos Babic, Radisav Curcic, Geert Hammink, Swen Nater, Gundars Vetra, and a bunch more I'm probably missing.
There's only a handful of guys who actually had an impact (or even saw more than limited minutes) out of that big group (of which I'm leaving out a whole bunch). Muresan, Rebraca, Kukoc, Divac, Radja, Smits, Marciulionis, Sabonis, Petrovic, Schrempf, Nater. That's 10-15 players out of maybe 100-200 who were drafted. The highest-drafted players were Smits at #2 and Yinka at #14. Both of them went to American colleges though.
My point is that I think it makes complete sense to draw an analogy between what a late 1st round pick was in 1980 and a late first round pick in 2005. Even though the number of teams increased, the talent pool widened too. So a 28th pick in 2005 will net you a lot better player than a 28th pick in 1980. |
|
| Back to top |
|
|
DSMok1
Joined: 05 Aug 2009
Posts: 611
Location: Where the wind comes sweeping down the plains
|
| Posted: Fri May 21, 2010 1:13 pm Post subject: |
|
|
| gabefarkas wrote: |
(I know I'm a little late with this reply...)
I think the talent pool expanded in line with the number of picks. At least, I think we have to assume that it did. In other words, those late-first-round foreign gems that teams started grabbing in the late 90's weren't even on the radar screen in the mid-80's. Or if they were, there were fewer of them and there were also fewer American-born players.
To me, the 1996 draft was the first one where you really see an influx of foreign talent, and even a few creeping into the first round (#14 Peja Stojakovic, #20 Zydrunas Ilgauskas, #23 Efthimi Rentzias, #25 Martin Muursepp). The 1998 draft was when the floodgates burst open (Dirk, Rasho Nesterovic, Mirsad Turkcan, Vladimir Stepania, Bruno Sundov).
Before '96, there you had players like: George Zidek (born in Czech Republic, but attended UCLA), Dragan Tarlac, Dejan Bodiroga, Constantin Popa (born in Romania, attended Miami), Aurelijius Zukauskas, Yinka Dare, Andrei Fetisov, William Njoku, Zeljko Rebraca, Gheorghe Muresan, Marcelo Nicola, Sasha Danilovic, Zan Tabak, Toni Kukoc, Stefano Rusconi, Vlade Divac, Dino Radja, Jose Vargas, Jorge Gonzalez, Rik Smits, Song Tao, Jose Antonio Montero, Sarunas Marciulionis, Franjo Arapovic, Georgi Glouchkov, Arvydas Sabonis, Drazen Petrovic, Stojko Vrankovic, Uwe Blab, Detlef Schrempf, Manute Bol, Milos Babic, Radisav Curcic, Geert Hammink, Swen Nater, Gundars Vetra, and a bunch more I'm probably missing.
There's only a handful of guys who actually had an impact (or even saw more than limited minutes) out of that big group (of which I'm leaving out a whole bunch). Muresan, Rebraca, Kukoc, Divac, Radja, Smits, Marciulionis, Sabonis, Petrovic, Schrempf, Nater. That's 10-15 players out of maybe 100-200 who were drafted. The highest-drafted players were Smits at #2 and Yinka at #14. Both of them went to American colleges though.
My point is that I think it makes complete sense to draw an analogy between what a late 1st round pick was in 1980 and a late first round pick in 2005. Even though the number of teams increased, the talent pool widened too. So a 28th pick in 2005 will net you a lot better player than a 28th pick in 1980. |
This chart disagrees with you about that last statement:
The curves are about the same 1-60, each year. I think there wasn't a big change at least in this regard. |
|
| Back to top |
|
|
DLew
Joined: 13 Nov 2006
Posts: 224
|
| Posted: Fri May 21, 2010 3:22 pm Post subject: |
|
|
| Can that be true? It seems to me that with more teams in the league now (and therefore more games), there must be more Win Shares. So, even assuming the quality of players drafted did not change, we should see the number of win shares per draft increase roughly in line with the increase in overall win shares. Right? |
|
| Back to top |
|
|
|
|
You cannot post new topics in this forum
You cannot reply to topics in this forum
You cannot edit your posts in this forum
You cannot delete your posts in this forum
You cannot vote in polls in this forum
|
Powered by phpBB © 2001, 2005 phpBB Group
|

