| View previous topic :: View next topic |
| Author |
Message |
Chilltown
Joined: 16 Apr 2010
Posts: 15
Location: Boston
|
 Posted: Wed Jan 05, 2011 10:39 pm Post subject: Momentum and The Rally Effect in College Basketball Posted: Wed Jan 05, 2011 10:39 pm Post subject: Momentum and The Rally Effect in College Basketball |
 |
|
After hearing announcers incessantly talking about momentum, I decided to try to take a quantitative look at one instance: does a team gain "momentum" going into overtime by tying the basketball game on their last possession? I dubbed this The Rally Effect.
I looked for evidence of momentum by comparing the actual results of the overtime period to the rallying team's expected win odds (calculated from Ken Pomeroy's awesome win odds graphs). I found 174 instances of a team tying the game on their last possession, and after creating a binomial distribution with conservative variance (p(1-p)=.25), my significance test failed to reject the null hypothesis of no momentum. The 174 rallying teams were expected to win 86 games, and actually won 78.
The full writeup, complete with deeper analysis, some important caveats, and a pretty distribution graph of start of OT win odds, can be found here: http://harvardsportsanalysis.wordpress.com/2011/01/05/momentum-in-college-basketball-do-late-rallies-carry-over-to-overtime/
Any thoughts or suggestions for further analysis? |
|
| Back to top |
|
 |
Ed Küpfer
Joined: 30 Dec 2004
Posts: 785
Location: Toronto
|
| Posted: Thu Jan 06, 2011 12:24 am Post subject: |
|
|
Nicely done, I thought I had the monopoly on posting negative results! But I'm not sure why you used in-game win probabilities -- aren't the probabilities going to be the same as pre-game probabilities, a la log5?
_________________
ed |
|
| Back to top |
|
|
Chilltown
Joined: 16 Apr 2010
Posts: 15
Location: Boston
|
| Posted: Thu Jan 06, 2011 12:26 am Post subject: |
|
|
| Ed Küpfer wrote: | | Nicely done, I thought I had the monopoly on posting negative results! But I'm not sure why you used in-game win probabilities -- aren't the probabilities going to be the same as pre-game probabilities, a la log5? |
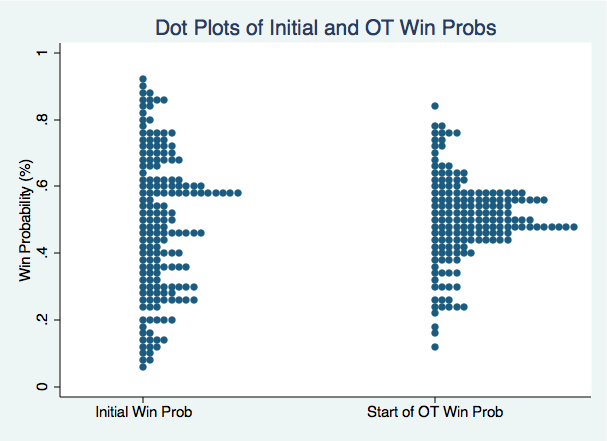
Actually, they aren't at all. This is because KenPom's formula (as I understand it) uses time left and number of possessions to create a constantly updating win probability. I collected the initial win probability for each game, as well. Now that I think about it, maybe a graph overlaying the two distributions (initial win prob and OT win prob) would be informative. Anyone know if thats possible on Stata?
EDIT: Just because, here is a dot plot comparing the start of the game win probability and the start of overtime win probability. As expected, the OT distribution is more approximately normal with more of the observations clustered between 40-60% win odds.
 [/img] [/img]
Last edited by Chilltown on Thu Jan 06, 2011 1:24 am; edited 1 time in total |
|
| Back to top |
|
|
Ed Küpfer
Joined: 30 Dec 2004
Posts: 785
Location: Toronto
|
| Posted: Thu Jan 06, 2011 1:07 am Post subject: |
|
|
| Chilltown wrote: | | Ed Küpfer wrote: | | But I'm not sure why you used in-game win probabilities -- aren't the probabilities going to be the same as pre-game probabilities, a la log5? |
Actually, they aren't at all. This is because KenPom's formula (as I understand it) uses time left and number of possessions to create a constantly updating win probability. I collected the initial win probability for each game, as well. |
You know what? I'm not very smart.
_________________
ed |
|
| Back to top |
|
|
Mike G
Joined: 14 Jan 2005
Posts: 3583
Location: Hendersonville, NC
|
| Posted: Thu Jan 06, 2011 6:38 am Post subject: Re: Momentum and The Rally Effect in College Basketball |
|
|
| Chilltown wrote: | ...does a team gain "momentum" going into overtime by tying the basketball game on their last possession?... The 174 rallying teams were expected to win 86 games, and actually won 78.
|
The winning rate 78/174 is just 45%, about what I'd guess by observation.
Often, a rallying team is playing without reservations, and/or the team being caught is playing too conservatively.
Then in an extra 5 minutes, they're playing once again on more similar terms. Or the rallying team may continue with the volatile lineup that tied the score.
Sometimes, announcers seem to be in competition to see who can first declare where the momentum has gone. I recall a football game in which they declared, "The momentum is just swinging wildly back and forth!"
_________________
`
36% of all statistics are wrong |
|
| Back to top |
|
|
DSMok1
Joined: 05 Aug 2009
Posts: 608
Location: Where the wind comes sweeping down the plains
|
| Posted: Thu Jan 06, 2011 7:17 am Post subject: |
|
|
| Chilltown wrote: |
EDIT: Just because, here is a dot plot comparing the start of the game win probability and the start of overtime win probability. As expected, the OT distribution is more approximately normal with more of the observations clustered between 40-60% win odds.
|
For interest sake--is that chart what would be expected, based on the pregame win probabilities adjusted for the shorter length of the sample? In other words, is this still skewed towards the better team like we would expect? It wouldn't be that hard to generate an expected overtime win% for a team with a given efficiency advantage pregame... if we knew how many possessions are typical in overtime (something more than 1/8th, I'd say).
_________________
GodismyJudgeOK.com/DStats |
|
| Back to top |
|
|
gabefarkas
Joined: 31 Dec 2004
Posts: 1313
Location: Durham, NC
|
| Posted: Sat Jan 08, 2011 2:47 pm Post subject: |
|
|
| Ed Küpfer wrote: | | Chilltown wrote: | | Ed Küpfer wrote: | | But I'm not sure why you used in-game win probabilities -- aren't the probabilities going to be the same as pre-game probabilities, a la log5? |
Actually, they aren't at all. This is because KenPom's formula (as I understand it) uses time left and number of possessions to create a constantly updating win probability. I collected the initial win probability for each game, as well. |
You know what? I'm not very smart. |
That's okay. I can't read or write. |
|
| Back to top |
|
|
|

