| View previous topic :: View next topic |
| Author |
Message |
davis21wylie2121
Joined: 13 Oct 2005
Posts: 535
Location: Atlanta, GA
|
 Posted: Fri Apr 18, 2008 6:29 pm Post subject: 2007-08 NBA Team Similarity Scores, Playoff Edition Posted: Fri Apr 18, 2008 6:29 pm Post subject: 2007-08 NBA Team Similarity Scores, Playoff Edition |
 |
|
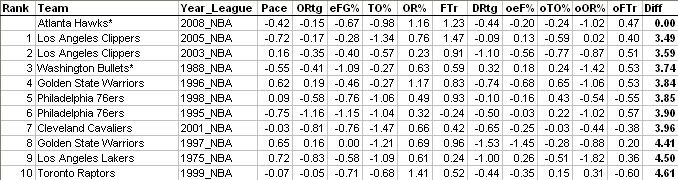
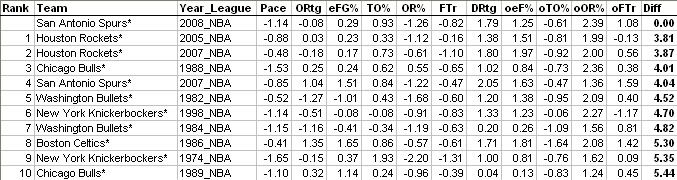
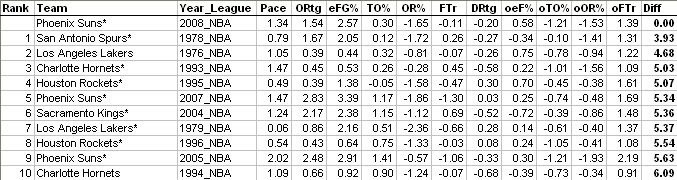
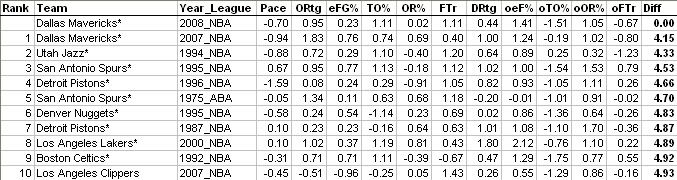
Okay, so the regular season is over and the playoffs are finally upon us... And as promised, I ran the numbers on Pace and the Four Factors -- offensive and defensive -- for every team since 1973-74 (ABA included). Then I compared the differences in z-scores to find the ten most similar teams to this year's crop of playoff squads.
Like I said with the college teams, I'm not even sure if this has any value, but it's kind of cool, so here goes...
(BTW, you can download the sim score excel file here, in case you want to run your own scores. It's called "NBASimScore.xls", and to run the scores, you paste the target team's data from "Teams" to the 2nd row of "SimTeam".)
Eastern Conference
1. Boston

VS.
8. Atlanta
4. Cleveland
VS.
5. Washington
3. Orlando

VS.
6. Toronto

2. Detroit
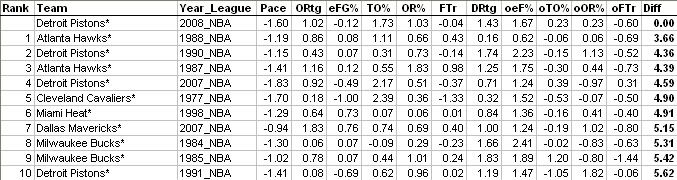
VS.
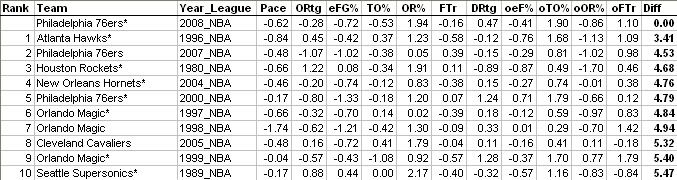
7. Philadelphia
Western Conference
1. LA Lakers

VS.
8. Denver
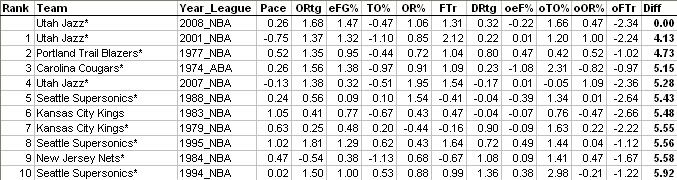
4. Utah
VS.
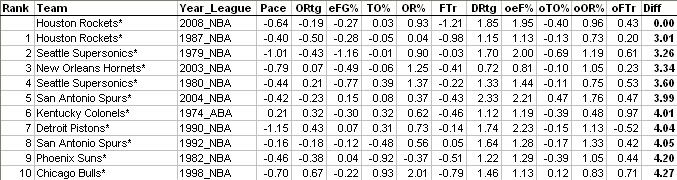
5. Houston
3. San Antonio
VS.
6. Phoenix
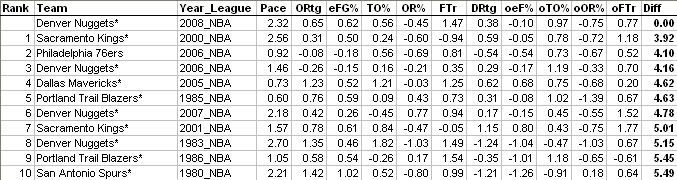
2. New Orleans

VS.
7. Dallas
Last edited by davis21wylie2121 on Fri Apr 18, 2008 11:14 pm; edited 2 times in total |
|
| Back to top |
|
 |
davis21wylie2121
Joined: 13 Oct 2005
Posts: 535
Location: Atlanta, GA
|
| Posted: Fri Apr 18, 2008 6:56 pm Post subject: |
|
|
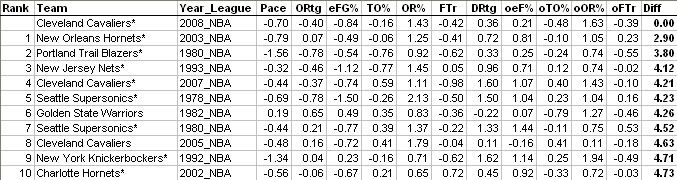
And here are this year's most similar teams to the "typical" NBA Champion since 1973-74:
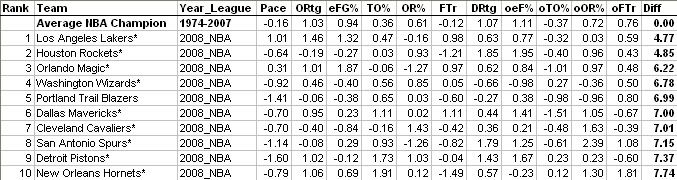
Now, I'm really not sure about the validity of comparing to the average NBA champ, because Phoenix, Boston, and Utah rank 21st, 23rd, and 27th in the league respectively, while the Knicks rank 11th.  |
|
| Back to top |
|
|
anarcholis
Joined: 12 Jun 2007
Posts: 13
|
| Posted: Fri Apr 18, 2008 10:31 pm Post subject: |
|
|
If you're really trying to get similar teams, shouldn't you add margin of victory to your calculation also? One of the Celtics' comparables is the 96-97 Pacers who won 39 games....that doesn't seem very similar.
But it is interesting to see what teams the contenders match up with. It would be neat to see how the top teams in the playoffs (Celts, Pistons, and the West) match up with past finalists. |
|
| Back to top |
|
|
94by50
Joined: 01 Jan 2006
Posts: 460
Location: Phoenix
|
| Posted: Fri Apr 18, 2008 10:44 pm Post subject: |
|
|
| My first question is: how are you getting your overall scores ("Diff")? |
|
| Back to top |
|
|
davis21wylie2121
Joined: 13 Oct 2005
Posts: 535
Location: Atlanta, GA
|
| Posted: Fri Apr 18, 2008 10:51 pm Post subject: |
|
|
It's the total sum of their differences in z-scores for Pace and the 8 Factors, as outlined here (it's basically what KenPom did, except for teams instead of individuals). To paraphrase Ken:
| Quote: | | By summing the differences in each of the 9 categories, the teams with the lowest totals are the most similar to the team I'm testing. Instead of arbitrarily determining the weight that each category gets, I am going to let the team's unique characteristics do that. If a team is unusually good or bad in a particular statistic, then more importance is placed on that statistic in determining which teams are most similar. |
|
|
| Back to top |
|
|
davis21wylie2121
Joined: 13 Oct 2005
Posts: 535
Location: Atlanta, GA
|
| Posted: Fri Apr 18, 2008 11:22 pm Post subject: |
|
|
| anarcholis wrote: | | If you're really trying to get similar teams, shouldn't you add margin of victory to your calculation also? One of the Celtics' comparables is the 96-97 Pacers who won 39 games....that doesn't seem very similar. |
I think the important thing to take away from the Celtics' lesser comps is just how unique Boston has been this season. A "Diff" of under 4 is good, under 5 is okay, and greater than 5 is really not very similar at all. Boston's top comp has a total difference of 4.23 standard deviations, a score which would rank much lower for other teams, and they have only 2 comps of <5. Also, 4 of their Top 10 comps have Diff scores over 6; only 2 other playoff teams (Phoenix, New Orleans) have comps in their top 10 who score 6 or higher at all, and those teams only have one such comp apiece. The take-home message is that the '08 Celtics have one of the most unique 4-factor profiles in NBA history -- there simply aren't very many good historical comps for them. |
|
| Back to top |
|
|
Mountain
Joined: 13 Mar 2007
Posts: 537
|
| Posted: Sat Apr 19, 2008 1:12 pm Post subject: |
|
|
Pretty straightforward to use- I see that by copying the data of a particular team into the sim team page I see the similarity results for any team. Handy.
I am exploring the application of 4 factor and overall efficency weights. That fits my personal preference better.
Last edited by Mountain on Thu Apr 24, 2008 11:24 am; edited 1 time in total |
|
| Back to top |
|
|
gabefarkas
Joined: 31 Dec 2004
Posts: 984
Location: Durham, NC
|
| Posted: Mon Apr 21, 2008 7:58 am Post subject: |
|
|
| davis21wylie2121 wrote: | | It's the total sum of their differences in z-scores for Pace and the 8 Factors, as outlined here (it's basically what KenPom did, except for teams instead of individuals). |
Why not use a Euclidean difference? |
|
| Back to top |
|
|
davis21wylie2121
Joined: 13 Oct 2005
Posts: 535
Location: Atlanta, GA
|
| Posted: Tue Apr 22, 2008 1:52 pm Post subject: |
|
|
Well, that would put the 8 factors and pace on different scales, so I'd have to arbitrarily weight each category differently, which I wanted to get away from (what I'd call the "Bill James School" of analysis says to arbitrarily weight certain categories when doing sim scores, but I find that Ken's method reduces that arbitrariness).
Also, without z-scores the numbers wouldn't be normalized for league... Although that begs the question: All things being equal, is a team with an average pace in 2008 (92.4 poss/gm) more similar to the average-paced team in the eighties (100+ poss/gm) or a very slow team in the eighties? |
|
| Back to top |
|
|
AJax
Joined: 22 Jan 2006
Posts: 48
Location: The Prairies of the Great Middle West
|
| Posted: Wed Apr 23, 2008 6:11 pm Post subject: |
|
|
Very very good stuff. Interesting to see that some teams are very similar to recent iterations of themselves (see Cavs, Pistons, Raptors and Nuggets) while others seem to have remade themselves completely (Magic, 76ers, Lakers).
Thanks for the spreadsheet, I'll definitely be looking at it. - Adam
Oh and LOL at Atlanta being extremely similar to the 2003 Clippers. Ouch. |
|
| Back to top |
|
|
|

