| View previous topic :: View next topic |
| Author |
Message |
wmchad
Joined: 16 Apr 2009
Posts: 13
Location: Portland, OR
|
 Posted: Thu Apr 30, 2009 3:14 pm Post subject: Pace vs. Efficiency Posted: Thu Apr 30, 2009 3:14 pm Post subject: Pace vs. Efficiency |
 |
|
Hello. I'm relatively new to the board, so please forgive my lack of knowledge, etiquette...
Has anyone looked at the relationship between pace and efficiency for teams? I've seen the thread on usage vs efficiency for players and was wondering if something similar could be seen on a team level. I would imagine that, if teams had an optimal pace, you would see a drop-off in efficiency as they moved away from that pace.
I've tried to do some regressions myself for this regular season, but I don't know how to interpret the results. For example, the highest r^2 for home defensive efficiency vs pace is Dallas: pace coefficient is -0.89, r^2 = 0.235. I tried a number of variations, including using a pace^2 term and trying to control for opponent strength, and my highest r^2 was 0.300. Has anyone else done a similar study?
Thank you,
Chad Young |
|
| Back to top |
|
 |
kjb
Joined: 03 Jan 2005
Posts: 863
Location: Washington, DC
|
| Posted: Thu Apr 30, 2009 3:46 pm Post subject: |
|
|
| I've done very limited looks at pace vs. efficiency. Generally, there seems to be miniscule effects on efficiency. If I'm recalling the numbers correctly, better defensive teams are a bit slower paced on average. But even that effect is pretty small, I think. |
|
| Back to top |
|
|
bchaikin
Joined: 27 Jan 2005
Posts: 682
Location: cleveland, ohio
|
| Posted: Thu Apr 30, 2009 8:44 pm Post subject: |
|
|
Has anyone looked at the relationship between pace and efficiency for teams?
looking at just some extremes, in this case the annual off/def pts/poss of the 5 teams with the fastest game pace versus the 5 teams with the slowest game pace over the past 30 seasons of the nba (since 1979-80):
column A - avg off pts/poss scored of the 5 teams with the fastest game pace
column B - avg def pts/poss allowed of the 5 teams with the fastest game pace
column C - avg off pts/poss scored of the 5 teams with the slowest game pace
column D - avg def pts/poss allowed of the 5 teams with the slowest game pace
--year--------A---------B---------C--------D--
197980---1.037---1.056---1.036---1.052
198081---1.049---1.033---1.039---1.068
198182---1.069---1.070---1.047---1.062
198283---1.042---1.055---1.009---1.012
198384---1.083---1.083---1.050---1.057
198485---1.060---1.067---1.054---1.074
198586---1.062---1.068---1.036---1.053
198687---1.057---1.072---1.083---1.056
198788---1.069---1.074---1.080---1.059
198889---1.081---1.055---1.074---1.037
198990---1.051---1.076---1.061---1.055
199091---1.060---1.075---1.063---1.061
199192---1.081---1.067---1.055---1.063
199293---1.071---1.070---1.079---1.063
199394---1.049---1.063---1.065---1.018
199495---1.104---1.078---1.064---1.039
199596---1.059---1.068---1.087---1.052
199697---1.041---1.090---1.055---1.032
199798---1.039---1.061---1.044---1.010
199899---1.011---1.016---1.021---0.991
199900---1.020---1.033---1.022---1.009
200001---1.017---1.017---1.016---0.999
200102---1.058---1.037---1.011---1.025
200203---1.020---1.039---1.013---1.015
200304---1.048---1.037---1.004---0.999
200405---1.059---1.047---1.041---1.036
200506---1.046---1.044---1.043---1.029
200607---1.078---1.065---1.066---1.035
200708---1.073---1.072---1.082---1.047
200809---1.087---1.091---1.076---1.056
average--1.057---1.060---1.050---1.040
you find at the extremes a slight advantage for higher offensive efficiency for the fastest paced teams annually, and a more pronounced advantage defensively for the slowest paced teams annually...
notice that there are 12 seasons where the 5 slowest game paced teams had an average off pts/poss scored that was actually higher than the 5 fastest game paced teams, including the five year stretch of 1995-96 to 1999-00..
but in only 2 seasons (1980-81 and 1984-85) did the 5 fastest paced teams have an average def pts/poss allowed that was less than the avg def pts/poss allowed of the 5 slowest paced teams... |
|
| Back to top |
|
|
Mountain
Joined: 13 Mar 2007
Posts: 1527
|
| Posted: Fri May 01, 2009 2:52 am Post subject: |
|
|
For the fast 5 offensive efficiency in 2008-9 was second best for the period compared to the other year's fast 5s but defensive efficiency was the worst in the group. For the slowest 5 I think it is 6th best on offense and 9th worst on defense.
The slow 5 had its 3rd biggest net efficiency spread in 2007-8 but lost about 40% of it this season.
The fast 5 have been negative on net about 2/3rds of the time. Last season wasn't far different from median but was a bit better compared to how the fast 5 have faired before.
If you look at the below mean pace teams, there were 9 who were above average on 3 pt makes, 8 made playoffs and I think 4 will advance.
Cavs were 2nd slowest, 1st on 3 pt makes within this group and 1st on defensive efficiency within the group. They are the standard for this consciously constructed style.
Below average pace and less average on 3 pt makes there were 7 and 3 made playoffs and up to 2 may advance.
Celtics are the class of this group. 4th on pace, 2nd on 3 pt makes, 1st on defensive efficiency.
For fast pace teams with above average 3 pt makes there were 8 only 3 made playoffs but at least 2 will advance.
Lakers were 4th in group on pace, 2nd on defensive effiiciency but last on 3 pt makes in that group.
For fast pace teams with below average 3 pt makes there were 6, 2 made playoffs, 1 still could advance- Chicago.
The last group was least successful- this season.
Odds are the champ will come from the first or third group- each with above mean 3 pt makes and almost certainly strong defense. Pace is the perhaps the weak partner in this threesome.
Last season Boston was the 2nd slowest among those above average on 3 pt makes, 2nd best on 3 pt makes in the group and best on defensive efficiency. Real close to what the Cavs are now. That is the formula I'd prefer / use if you have the coach & talent for it.
Offensive efficiency is obviously important but I wanted to put the focus on the pace- 3 pt - defensive efficiency relationship.
Last edited by Mountain on Fri May 01, 2009 11:38 pm; edited 2 times in total |
|
| Back to top |
|
|
gabefarkas
Joined: 31 Dec 2004
Posts: 1313
Location: Durham, NC
|
| Posted: Fri May 01, 2009 7:33 am Post subject: |
|
|
Are you asking about teams compared to other teams, or within-team fluctuations game-to-game?
For example, are you trying to (hypothetically) say that Team A, who plays at a fast pace, has a better Off Eff than Team B, who plays at a slower pace? Or are you trying to say that Team A has a better Off Eff when playing in games at a faster pace than it does when playing in games at a slower pace? |
|
| Back to top |
|
|
wmchad
Joined: 16 Apr 2009
Posts: 13
Location: Portland, OR
|
| Posted: Fri May 01, 2009 10:22 am Post subject: |
|
|
| Quote: |
Are you asking about teams compared to other teams, or within-team fluctuations game-to-game? |
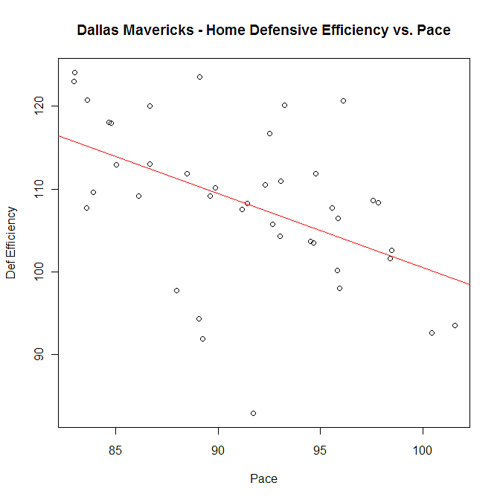
I was specifically asking about within-team fluctuations. I know there are a lot of factors, but I thought that if a team has a 'natural' pace, then they would prefer to play at that pace and you would see fall off in efficiency as they deviated from that pace. I tried looking at offensive and defensive efficiency as well as efficiency differential. I also tried adjusting for opponent strength.
As an example, here is the Mavericks' home defensive efficiency for the season.
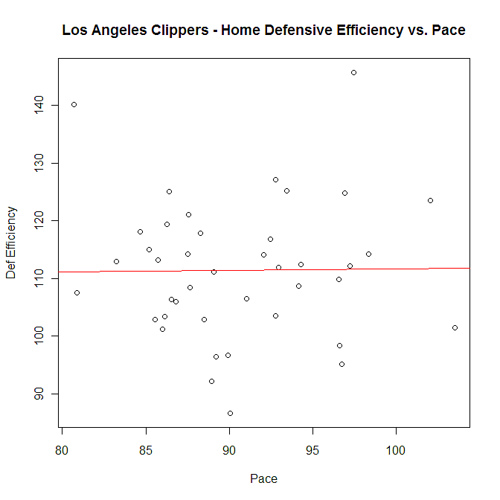
As opposed to the same graph for the Clippers.
 |
|
| Back to top |
|
|
Mountain
Joined: 13 Mar 2007
Posts: 1527
|
| Posted: Fri May 01, 2009 11:40 pm Post subject: |
|
|
Charts like this are useful. More useful than just the averages.
I see only 1.5 teams on average play above 94 average pace in the last 6 playoffs. Less than 10%. This regular season 23% played at least this fast; in playoffs none so far. You better be able to win slower than real fast. |
|
| Back to top |
|
|
Mike G
Joined: 14 Jan 2005
Posts: 3551
Location: Hendersonville, NC
|
| Posted: Sat May 02, 2009 5:48 am Post subject: |
|
|
Any reason a team would have more of a preferred pace at home (vs away)? Home+Away gives you twice the sample size.
_________________
`
36% of all statistics are wrong |
|
| Back to top |
|
|
wmchad
Joined: 16 Apr 2009
Posts: 13
Location: Portland, OR
|
| Posted: Sat May 02, 2009 7:35 am Post subject: |
|
|
| I mainly separated them out because I wasn't adjusting for the home/away difference in efficiency. I may try running them again for all games with the adjustment to get the larger sample. |
|
| Back to top |
|
|
kjb
Joined: 03 Jan 2005
Posts: 863
Location: Washington, DC
|
| Posted: Mon May 04, 2009 12:59 pm Post subject: |
|
|
What r^2 are you getting on those charts? When I generate similar charts in Excel for the Wizards, I'm getting 0.0032 on ortg and 0.0004 on the drtg. That's when I do the linear trendline. I get highest r^2 when I use the polynomial trendline with order set to 6. Those are still very low.
In fact, I get the strongest r^2 for this sort of thing when I first calculate the team's average performance by pace. So, if they have 6 games at a pace factor of 90, then I just average those together. Then I create the same chart using the polynomial trendline with order set to 6.
Here's what it looks like:
 |
|
| Back to top |
|
|
wmchad
Joined: 16 Apr 2009
Posts: 13
Location: Portland, OR
|
| Posted: Wed May 06, 2009 12:05 pm Post subject: |
|
|
The r^2 for the Dallas chart was 0.235. For the Clippers chart it was basically 0 (< 0.0001). I'm on vacation so I can't look up what I had for the Wizards, but they could have been anything in between those.
I used pace and pace^2 (polynomial order 2) regressions because I couldn't think of a reason that the data might respond to a higher order than that. A polynomial regression will always have an r^2 equal to or higher than another with a lower order polynomial, so that's why you get the highest r^2 when the order is 6.
Also, averaging games at a certain pace will increase your r^2 because you're removing outliers. I have considered looking at a running local average (finding the average efficiency at a pace +/- 2 possessions). Just to see what the data looks like.
When I get back from vacation I can look up what I have for the Wizards if you want. Looking at your data, you might want to subtract offensive efficiency from defensive efficiency (by pace) and see what you come up with. |
|
| Back to top |
|
|
wmchad
Joined: 16 Apr 2009
Posts: 13
Location: Portland, OR
|
| Posted: Wed May 13, 2009 6:41 pm Post subject: |
|
|
| I looked up the data I have for the Wizards, and I get low r^2s for them across the board. The highest I have is 0.020 for home defensive efficiency, and none of the regressions have a t value > 1 (from what I understand, higher t value means greater confidence that something is significant - I think you want it to be > 2). Contrast this with the Dallas results I put up earlier, where the r^2 is 0.235 and the t value is ~ 3.5. As far as I know (and I'm just starting to learn here, so please correct me if I'm wrong), what I'm seeing indicates that pace does not have an observable effect on the Wizard's efficiency, whereas it appears to have at least some effect for the Mavericks - at least in the case of home defensive efficiency. |
|
| Back to top |
|
|
|

