 |
APBRmetrics
The statistical revolution will not be televised.
|
| View previous topic :: View next topic |
| Author |
Message |
DJE09
Joined: 05 May 2009
Posts: 148
|
 Posted: Sat Sep 05, 2009 4:42 am Post subject: Starters vs Reserves Posted: Sat Sep 05, 2009 4:42 am Post subject: Starters vs Reserves |
 |
|
At 82games they give a nice breakdown of the regular season. All 11 teams with positive +/- from the bench made the playoffs.
Charting +/- accounting for Minutes allocated gives something like:
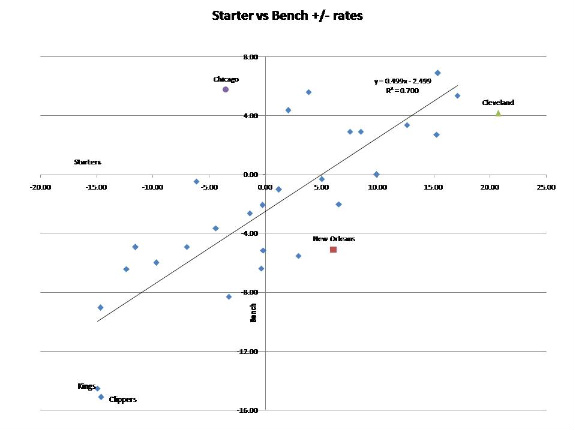
Not suprisingly the three blue points up by Cleveland are BOS, LAL, and ORL. ...
I have two questions:
1) should we interpret a poor bench performance as being a lack of depth or injury? (eg. NOH)
2) Is bench performance a function of a good 6th (& 7th option) or depth?
Or is this something you can only evaluate on a team by team basis. |
|
| Back to top |
|
 |
HoopStudies
Joined: 30 Dec 2004
Posts: 706
Location: Near Philadelphia, PA
|
| Posted: Sat Sep 05, 2009 11:47 am Post subject: |
|
|
I didn't see it explained there, but what does the number even mean? What do the labels "starters" and "reserves" mean? Not sure how this is calculated. Obviously, you rarely substitute out all the starters for a bunch of reserves...
_________________
Dean Oliver
Author, Basketball on Paper
The postings are my own & don't necess represent positions, strategies or opinions of employers. |
|
| Back to top |
|
|
Roland_Beech
Joined: 14 Jan 2005
Posts: 43
|
| Posted: Sat Sep 05, 2009 1:03 pm Post subject: |
|
|
I guess I should answer the question here, since lord knows you won't find any explanations on the site itself...
those stats are simply a function of the five starters in a game are all counted in the starter section, any player who plays in the game who is not a starter is a reserve. So you do get weird stuff on the +/- where with say three starters and two reserves in it's counting 3x in the starter section, 2x in the reserve, etc
the importance of bench scoring? eh, Lakers ranked 16th, Orlando 29th (celtics 16th in 07-08) |
|
| Back to top |
|
|
Ilardi
Joined: 15 May 2008
Posts: 265
Location: Lawrence, KS
|
| Posted: Sat Sep 05, 2009 1:20 pm Post subject: |
|
|
| Roland_Beech wrote: | | the importance of bench scoring? eh, Lakers ranked 16th, Orlando 29th (celtics 16th in 07-08 ) |
Roland, are those ranks for bench scoring, or for bench scoring margin? If it's the former, then I wonder how the Lakers, Magic, and Celts ranked on the latter? |
|
| Back to top |
|
|
DJE09
Joined: 05 May 2009
Posts: 148
|
| Posted: Sat Sep 05, 2009 6:49 pm Post subject: |
|
|
Further to Roland's note (the only way the data made any sense - I am used to making the effort to get at the rare data only available at 82games  ), I took the "Raw" +/- and divided by the minutes, so we got an indication of performance "per minute". You'd have to make a few changes to get a number that represented per game margin. ), I took the "Raw" +/- and divided by the minutes, so we got an indication of performance "per minute". You'd have to make a few changes to get a number that represented per game margin.
Of course, there is no adjustment for team mates / opponents, but then the numbers do reflect actual team performance. There are obviously going to be some players like Odom, who are counted as starters for some games and bench for others ...
I like some of the results, because it shows how much NOH's lack of depth hurt their team performance. Interesting result for Chicago, perhaps indicating that it was due to above average bench performance that they made the playoffs.
POR, SAS, DEN, HOU, UTH, and ATL are the other teams in the upper right quadrant. DAL, PHX, MIA and PHI are in same quadrant as NOH.
Interestingly, LAL maintained the RS rate of bench playing at about 35% of minutes (due to Odom), CLE was more what we would expect and dropped bench minutes down to 25% from just over 33%. |
|
| Back to top |
|
|
Crow
Joined: 20 Jan 2009
Posts: 821
|
| Posted: Sun Sep 06, 2009 2:56 am Post subject: |
|
|
Chicago could have been a lot better with a more optimized, concentrated lineup distribution. They played almost 350 combinations and 7 of their top 8 used lineups were -5 or far worse on lineup adjusted.
Going forward they should play a ton of Rose-Hinrich, Salmons mainly with Hinrich and only as much as you have to as filler, trade Thomas if they can and don't be afraid to go Noah-Miller. Try Rose-Hinrich-Deng-Noah-Miller and if it works as good as it looks play it heavily or put the better rookie PF in there. |
|
| Back to top |
|
|
|
|
You cannot post new topics in this forum
You cannot reply to topics in this forum
You cannot edit your posts in this forum
You cannot delete your posts in this forum
You cannot vote in polls in this forum
|
Powered by phpBB © 2001, 2005 phpBB Group
|

