| View previous topic :: View next topic |
| Author |
Message |
Mike G
Joined: 14 Jan 2005
Posts: 3604
Location: Hendersonville, NC
|
 Posted: Sat Apr 23, 2005 9:01 pm Post subject: eWins update Posted: Sat Apr 23, 2005 9:01 pm Post subject: eWins update |
 |
|
eWins, as I'm calling it for now, is a compromise of sorts, between crediting players for team success, and giving individuals due credit for their own play. Teams whose eWin totals are >41 tend to be winning teams, with the difference (eW-41) being just half what their expected wins over 41 will be. Not sure how to verbalize that. But if a team's individual eW are 46, then the formula is 2*46-41 = 51. If your players total 5 eW over .500, your team will be 10 wins over .500. Same goes for teams under 41 eW.
Here's how 2005 teams total on eW; expected wins: 2*eW-41 ; pythagorean expected wins based on point-differential; and then actual W-L record. I made no attempt to correlate to W-L record; otherwise, about 14 factors are adjusted to maximize correlation between xW and pW.
eW - xW - pW . team . . W - L
50.5 60.0 62.8 San Antonio 59 - 23
50.0 59.0 58.9 Phoenix 62 - 20
50.0 58.9 58.8 Miami 59 - 23
48.8 56.6 56.7 Dallas 58 - 24
46.2 51.4 52.8 Detroit 54 - 28
45.5 50.0 53.1 Houston 51 - 31
45.0 49.0 46.9 Denver 49 - 33
44.9 48.8 47.0 Sacramento 50 - 32
44.6 48.3 47.7 Seattle 52 - 30
44.4 47.7 48.1 Memphis 45 - 37
43.2 45.3 45.3 Minnesota 44 - 38
42.4 43.8 43.4 Cleveland 42 - 40
42.0 43.1 43.5 Boston 45 - 37
41.6 42.3 38.7 LAClippers 37 - 45
40.7 40.4 43.3 Indiana 44 - 38
40.0 39.1 44.2 Chicago 47 - 35
39.7 38.3 40.1 Washington 45 - 37
39.5 38.0 38.9 Philadelphia 43 - 39
38.8 36.5 36.4 Toronto 33 - 49
38.6 36.3 36.3 New Jersey 42 - 40
38.0 35.0 34.8 Golden St. 34 - 48
37.9 34.8 34.0 New York 33 - 49
37.4 33.9 34.7 Orlando 36 - 46
37.4 33.8 29.2 Portland 27 - 55
37.3 33.6 32.4 Milwaukee 30 - 52
37.1 33.1 32.6 LA Lakers 34 - 48
35.5 30.1 28.5 Utah 26 - 56
34.1 27.1 24.3 Charlotte 18 - 64
30.2 19.4 20.8 New Orleans 18 - 64
28.7 16.3 16.3 Atlanta 13 - 69
Average error between columns 2 and 3 is 1.39 |
|
| Back to top |
|
 |
jambalaya
Joined: 30 Jan 2005
Posts: 282
|
| Posted: Sat Apr 23, 2005 10:26 pm Post subject: ewin fit |
|
|
that looks like a pretty good fit. it is very good for top 40% of league, the next 40% i would expect some more bouncing around of actual wins compared to prediction depending of coaching talent and veteran winning knowledge and effort as they relate to winning close games as previously discussed. the bottom 20% of projections much could perhaps be skewed even lower by the formula for a better fit if you were comfortable doing so.
are you willing to reveal the 14 weights as they current are? what are the new ones? |
|
| Back to top |
|
|
Mike G
Joined: 14 Jan 2005
Posts: 3604
Location: Hendersonville, NC
|
| Posted: Sun Apr 24, 2005 10:04 am Post subject: |
|
|
I've done correlations from the 1978 season to the present one. Some factors show steady evolution, while others are all over the place. When I look at teams that just refuse to correlate well, I see this common feature: underachieving teams have major players missing large chunks of the season. Either from injury, or due to trade.
So while a couple of your players might play 55 games and earn sizeable eWins, those missed games play havoc with your schedule. Effectively, you may jerk around from "being" a 50-win team, to "being" a 20-win team, etc. Just as total eW do not add up to actual team wins, part-seasons don't add up linearly.
This year's most-undervalued team is the Bulls. Looking at their roster, they've hardly missed any games. By contrast, the Blazers missed hundreds of player-games.
Sco 1.00
Reb .83
Ast 1.196
PF -.19
Stl 1.415
TO -1.44
Blk 1.03
Team Rebound/Opponent Rebound ratio is raised to the .91 power. This is factored into the Rebound rate.
TS% of comparison is .513
TS% is divided by .513, and that ratio is raised to the 1.006 power. This becomes a factor in the Scoring rate.
Minutes/36 is raised to the .415 power.
Replacement Player is determined to be 12.00 in my "total" scale, and subtracted from each player's total rates.
That last factor (VORP) is the actual value that when given Zero eWins, provides the closest correlations. I didn't know, at first, if this number would be near zero, or what. But it turns out that there are 387 players who appeared this year at a higher value (80-some below that value). That's just about 13 per team.
So, players worse than that actually aren't helping their teams win. They are just experiments that don't pan out, guys playing garbage minutes, etc.
The rates listed above are all scaled to minutes played, non-linearly, as follows: min/36 * (32/min)^.25
Scoring is scaled to 103.4/Opp Pts
Rebounding is scaled to 41.5/Opp Reb
Assists are scaled to 206.8/(total Pts)
Edits made above and:
Scoring is scaled to (AstFG%)^.117
Last edited by Mike G on Tue Apr 26, 2005 11:12 am; edited 1 time in total |
|
| Back to top |
|
|
Mike G
Joined: 14 Jan 2005
Posts: 3604
Location: Hendersonville, NC
|
| Posted: Sun Apr 24, 2005 11:46 am Post subject: |
|
|
I think I need to know every player's assisted FG %, as reported at 82games. It would be hugely time-consuming to copy this from each player's page at the site. Does anyone have an excel file containing this number from the just-completed season? It would be an immense benefit. Thanks in advance.
(With assist rates weighted as above, Steve Nash is #83 in eWins/48 minutes. This is just unacceptable. The only way I can imagine giving assists their proper due is if unassisted FG are separated from assisted FG.) |
|
| Back to top |
|
|
Roland_Beech
Joined: 14 Jan 2005
Posts: 43
|
| Posted: Mon Apr 25, 2005 7:28 pm Post subject: |
|
|
all right, I can't figure out how to post this here and have it display in an easy to use fashion, so download the file from here:
http://www.82games.com/astfg.xls
assisted Fg% (Assisted FGM / Total FGM)
blocked FGA% |
|
| Back to top |
|
|
Roland_Beech
Joined: 14 Jan 2005
Posts: 43
|
| Posted: Mon Apr 25, 2005 7:44 pm Post subject: |
|
|
and just for fun (not meaning to digress from this thread) here are the leaders:
Most ast'd (min 200 FGA)
94% Hoiberg
87% Bowen (SA)
87% Doleac
86% Harris (Cle)
86% Marshall
86% Korver
Least ast'd
20% Nash
22% Iverson
23% Tinsley
25% Wade
25% Francis
Most blocked
20% Fortson
17% Evans
15% Thomas (Was)
13% Krstic
13% Collison
[...three Seattle guys, hmmm]
Least blocked
1.1% Van Exel
1.3% Baron Davis in NO vs 4.5% in GS...hmmm
1.3% Jackson (Pho)
1.4% D.Jones
1.5% Miller (Ind) |
|
| Back to top |
|
|
HoopStudies
Joined: 30 Dec 2004
Posts: 705
Location: Near Philadelphia, PA
|
| Posted: Mon Apr 25, 2005 9:05 pm Post subject: |
|
|
| Roland_Beech wrote: | and just for fun (not meaning to digress from this thread) here are the leaders:
Most blocked
20% Fortson
17% Evans
15% Thomas (Was)
13% Krstic
13% Collison
[...three Seattle guys, hmmm]
|
And for those who watch the Sonics a lot, this is not a surprise. 3 undersized PFs who bring their lunch pail every day. As I recall, Karl Malone often led the league in this category, telling you how meaningless it is...
_________________
Dean Oliver
Author, Basketball on Paper
The postings are my own & don't necess represent positions, strategies or opinions of employers. |
|
| Back to top |
|
|
gabefarkas
Joined: 31 Dec 2004
Posts: 1313
Location: Durham, NC
|
| Posted: Mon Apr 25, 2005 9:25 pm Post subject: |
|
|
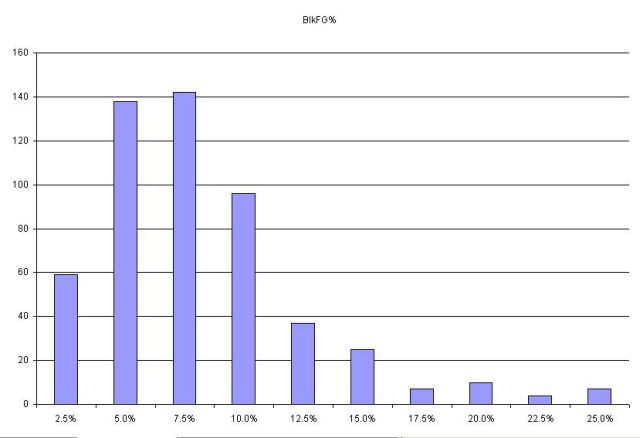
at first cut, these look fairly "normal" to me. i want to give it some more thought to see what i can pull out of it.
Distribution of % of assisted FGM:
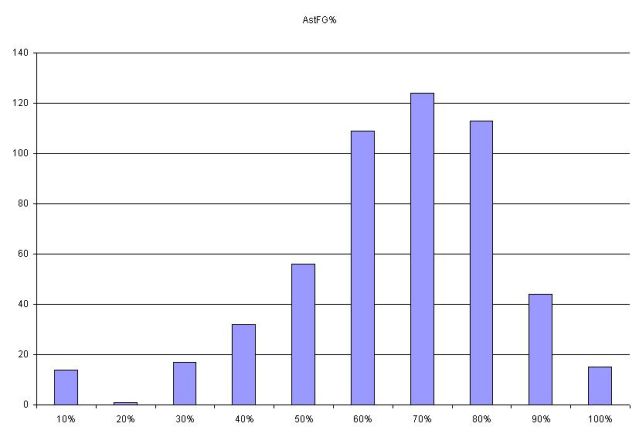
and, distribution of % of FGA blocks:
 |
|
| Back to top |
|
|
Mike G
Joined: 14 Jan 2005
Posts: 3604
Location: Hendersonville, NC
|
| Posted: Tue Apr 26, 2005 10:01 am Post subject: |
|
|
| Thanks, Roland! Just what the doctor ordered. |
|
| Back to top |
|
|
|

