| View previous topic :: View next topic |
| Author |
Message |
Ryan J. Parker
Joined: 23 Mar 2007
Posts: 711
Location: Raleigh, NC
|
|
| Back to top |
|
 |
habetw4
Joined: 12 Nov 2009
Posts: 22
Location: CT
|
 Posted: Tue Dec 08, 2009 10:47 am Post subject: Posted: Tue Dec 08, 2009 10:47 am Post subject: |
 |
|
That's exactly the stuff you'd like to see. The next step is doing the study league-wide to compare.
_________________
I'm a twitterererer: @tomhaberstroh. |
|
| Back to top |
|
|
deepak
Joined: 26 Apr 2006
Posts: 665
|
| Posted: Tue Dec 08, 2009 1:03 pm Post subject: Re: Rockets PBP Analysis |
|
|
That's me. Thanks for your PBP spreadsheets. One of these days, I need to figure out how to do that for myself before you're taken by an NBA team.  |
|
| Back to top |
|
|
stareagle
Joined: 19 Feb 2009
Posts: 65
|
| Posted: Tue Dec 08, 2009 5:21 pm Post subject: Re: Rockets PBP Analysis |
|
|
| deepak_e wrote: | | That's me. |
Great stuff!
I'm glad more people are using Ryan's brilliant PBP spreadsheets. I keep downloading the Pistons games and trying to find the time to do about 30 things with them. |
|
| Back to top |
|
|
Ryan J. Parker
Joined: 23 Mar 2007
Posts: 711
Location: Raleigh, NC
|
| Posted: Wed Dec 09, 2009 7:45 am Post subject: |
|
|
I love the way this looks.
_________________
I am a basketball geek. |
|
| Back to top |
|
|
deepak
Joined: 26 Apr 2006
Posts: 665
|
| Posted: Wed Dec 09, 2009 10:02 am Post subject: |
|
|
| Ryan J. Parker wrote: | I love the way this looks.
|
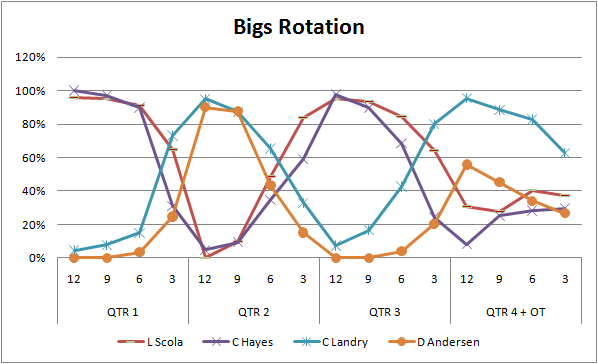
Thanks. It illustrates the percentage of minutes each player played in a given 3-minute time segment, though "rotation chart" may be a misnomer because it doesn't quite tell you which players are playing together.
Any thoughts on how that could be represented better graphically? The chart is a little cluttered as is, unfortunately. |
|
| Back to top |
|
|
Ed Küpfer
Joined: 30 Dec 2004
Posts: 785
Location: Toronto
|
| Posted: Wed Dec 09, 2009 12:02 pm Post subject: |
|
|
Your graph does a good job of telling the story. I only have minor formatting suggestions.
- y axis should only go to 100%.
- Horizontal gridlines aren't useful because you're never going to get (or want) precise values from the graph. Graphs are for stories, tables are for precision.
- I wouldn't use points as well as lines. I think the lines do a good job of showing the patterns.
- I would group Hayes/Scola and Andersen/Landry by colour, but use two different linetypes.
- I would remove the data labels from the bottom of the graph, and attach them to the lines themselves at the rightmost point.
_________________
ed |
|
| Back to top |
|
|
RChung
Joined: 28 Nov 2009
Posts: 10
|
| Posted: Wed Dec 09, 2009 12:46 pm Post subject: |
|
|
| deepak_e wrote: | | Thanks. It illustrates the percentage of minutes each player played in a given 3-minute time segment, though "rotation chart" may be a misnomer because it doesn't quite tell you which players are playing together. |
Well, maybe it doesn't quite tell you that but it does suggest that the analytical issues are challenging. What are the raw and adjusted +/- for these guys? |
|
| Back to top |
|
|
deepak
Joined: 26 Apr 2006
Posts: 665
|
| Posted: Wed Dec 09, 2009 1:52 pm Post subject: |
|
|
| Ed Küpfer wrote: | Your graph does a good job of telling the story. I only have minor formatting suggestions.
- y axis should only go to 100%.
- Horizontal gridlines aren't useful because you're never going to get (or want) precise values from the graph. Graphs are for stories, tables are for precision.
- I wouldn't use points as well as lines. I think the lines do a good job of showing the patterns.
- I would group Hayes/Scola and Andersen/Landry by colour, but use two different linetypes.
- I would remove the data labels from the bottom of the graph, and attach them to the lines themselves at the rightmost point.
|
Thanks for the suggestions. For the fourth bullet, do you mean that each of the four players would have a different line type, but they would be grouped by color into starters and reserves?
| RChung wrote: | | deepak_e wrote: | | Thanks. It illustrates the percentage of minutes each player played in a given 3-minute time segment, though "rotation chart" may be a misnomer because it doesn't quite tell you which players are playing together. |
Well, maybe it doesn't quite tell you that but it does suggest that the analytical issues are challenging. What are the raw and adjusted +/- for these guys? |
Scola and Hayes play the most minutes together, and according to basketballvalue Hayes has the highest adjusted +/- on the team (+24) while Scola has the lowest (-17). Raw +/- is +5.7 for Hayes, -2.6 for Scola.
Scola adjusted +/- has dropped considerably in just the last 3 games or so, however. Hayes has been rated at the top for the team pretty much the entire season. |
|
| Back to top |
|
|
RChung
Joined: 28 Nov 2009
Posts: 10
|
| Posted: Wed Dec 09, 2009 2:21 pm Post subject: |
|
|
| deepak_e wrote: |
Scola and Hayes play the most minutes together, and according to basketballvalue Hayes has the highest adjusted +/- on the team (+24) while Scola has the lowest (-17). Raw +/- is +5.7 for Hayes, -2.6 for Scola.
Scola adjusted +/- has dropped considerably in just the last 3 games or so, however. Hayes has been rated at the top for the team pretty much the entire season. |
Sounds consistent with the algorithm having a hard time prying apart the contributions of guys who are on the court at the same time. |
|
| Back to top |
|
|
Ed Küpfer
Joined: 30 Dec 2004
Posts: 785
Location: Toronto
|
| Posted: Wed Dec 09, 2009 2:22 pm Post subject: |
|
|
| deepak_e wrote: | For the fourth bullet, do you mean that each of the four players would have a different line type, but they would be grouped by color into starters and reserves?
|
I meant group the starters/reserves one way (say by colour), and group the 4s/5s a different way (say by linetype).
Also, I'm looking at the 4th quarter, where there is more of a mess. I'm wondering if a separate, more detailed look at that would be helpful.
But a really nice, clear graph nonetheless.
_________________
ed |
|
| Back to top |
|
|
Crow
Joined: 20 Jan 2009
Posts: 810
|
| Posted: Thu Dec 10, 2009 4:04 am Post subject: |
|
|
Don't have Adjusted +/- Factors for the current season and the error terms would be so large right now it probably wouldn't help much but
the Adjusted Factors of Scola, Landry and Hayes from past seasons might be worth some consideration in trying to interpret results this season,
and also the raw Player Pair data
C. Hayes C. Landry 82 min + .448 per min
L. Scola C. Hayes 411 min +.063
Andersen-Landry 250 min +.099
D. Andersen C. Hayes 8 min +.121
D. Andersen L. Scola 14 min -.339
don't immediately have Scola-Landry precisely but it appears at least moderately negative and probably more in substantial use
and the overall Adjusted Pair data- if Wayne Winston or anyone else wanted to provide it
and Adjusted Pair Offensive and Defensive splits and the Factor data could be calculated too if any with Adjusted models wanted to take it to the level (Difficulty separating one payer from another? For some situations / purposes you may not have to)
though the perimeters will have their effects and players aren't the same in all interior pairs or with all perimeter matchings.
No earlier NBA data for Anderson but you could speculate from the raw and Adjusted data shows so far and maybe even look into similar detail from his European record. (I assume that was worked over pretty hard?)
You'd probably have to aggregate the lineup data to some extent to make any findings or better guesses.
It might be a useful exercise. I mean, look at it as many ways as possible and then try to integrate and see what's real or as real as you can process what's real? The image is always somewhat in the eye of the beholder and how they see or how they try to see? |
|
| Back to top |
|
|
deepak
Joined: 26 Apr 2006
Posts: 665
|
| Posted: Fri Dec 11, 2009 9:29 am Post subject: |
|
|
Just FYI, as of yesterday I am now a contributing blogger at Red94.net, the Rockets affiliate in the TrueHoop blog network. My first entry was yesterday on Rockets stats within the first 7 seconds of their offensive possessions. Again, Ryan's PBPs were the basis for this investigation.
http://www.red94.net/?p=161
All comments/suggestions/critiques are welcome. |
|
| Back to top |
|
|
Kevin Pelton
Site Admin
Joined: 30 Dec 2004
Posts: 979
Location: Seattle
|
| Posted: Fri Dec 11, 2009 12:17 pm Post subject: |
|
|
| Good. When I saw that post on TrueHoop, I figured you'd be the right fit. |
|
| Back to top |
|
|
bstenger
Joined: 10 Nov 2005
Posts: 15
Location: San Francisco, CA
|
|
| Back to top |
|
|
|


