| View previous topic :: View next topic |
| Author |
Message |
jsill
Joined: 19 Aug 2009
Posts: 73
|
 Posted: Thu Nov 26, 2009 2:35 pm Post subject: Four Factors APM available at hoopnumbers.com Posted: Thu Nov 26, 2009 2:35 pm Post subject: Four Factors APM available at hoopnumbers.com |
 |
|
I've run 4 separate (regularized) adjusted +/- analyses for each of Dean Oliver's four factors (effective field goal percentage, offensive rebounding percentage, turnover percentage, and free throws made per non-turnover possession). Players are evaluated from the offensive and defensive end, for a total of 8 numbers for each player. So instead of a standard APM which predicts scoring margin for the game snippet, these regressions predict e.g. the effective field goald percentage or the turnover percentage.
Here's a writeup, with links to the results. I have overall pages which merge the results for all four factors on offense and defense, and I also have rankings based on each of the factors and discussions of those factors.
Thanks for any feedback, and Happy Thanksgiving! |
|
| Back to top |
|
 |
Crow
Joined: 20 Jan 2009
Posts: 806
|
| Posted: Thu Nov 26, 2009 2:54 pm Post subject: |
|
|
I am very very pleased this day has come. I've wanted this detail for years but you've given it the time & effort to produce it. Thanks very much.
This could be a very major advancement- in advancement in food for thought, not necessarily the final word as you note. I'll be looking at the data later.
Even though you say inquiries about r2, etc. can be done by e-mail would you be willing to say if the error on the Factor Adjusted estimates are similar to the overall Adjusted +/- estimates or a bit higher or much higher? |
|
| Back to top |
|
|
jsill
Joined: 19 Aug 2009
Posts: 73
|
| Posted: Fri Nov 27, 2009 12:44 am Post subject: |
|
|
Crow:
I don't have the numbers in front of me, but as I recall, the r-squareds were actually a bit lower when predicting one of the four factors individually than when predicting the margin of victory. To make it analogous to predicting margin of victory, I looked at the predicting game-level margins for the individual factor, e.g., predicting by how much one team's effective field goal percentage exceeded the other team's effective field goal percentage over the course of the game. I believe the best I was able to do for any of the factors was around 12% r-squared, versus 17% for margin of victory. I am not 100% sure of my memory on these numbers, so I'll double-check and get back to you later if I misremembered.
Here's one way to think about why it might be easier to predict margin of victory than individual factors. If you have a good team that's above average in all four factors, then they aren't necessarily going to perform at a high level in terms of all four factors all the time. Some games they might shoot well but not rebound well, whereas other games they might rebound well and not shoot well, etc. If you think of their overall performance as some kind of weighted average of their performances on the individual factors, then it might be expected that this average might be less random than any of the four components, since some of the randomness will wash out in the averaging. |
|
| Back to top |
|
|
Crow
Joined: 20 Jan 2009
Posts: 806
|
| Posted: Fri Nov 27, 2009 3:46 am Post subject: |
|
|
A few things I noticed:
Offense
Effective FG % RAPM
Only 16 guys impact it by 1+%.
Nash almost twice the impact of #2.
Sharpshooting ex-Sonics (who weren't kept to be Thunder leaders) were #2 and #3
35 more guys between +0.5 and +!%.
Only 1/3 positive.
Arguably Durant was the lowest ranked star but he was just outside the bottom 20%.
One issue with this score is how much of the impact positive or negative is related to their direct shooting impact vs their impact on the eFG% of teammates. There would be ways to calculate differences between Effective FG % RAPM and a player's personal Statistical eFG% impact compared to league average (and the same approach for other Factors) but it there would still be interpretation issues.
FTM/(100 Non-Turnover Possessions) RAPM
A bit more than 1/3 positive.
Surprises?
Maybe Granger. Certainly Korver and Posey. Are they opening space for others and having an impact on team frequency of getting to the line because of their 3 point shooting? Travis Outlaw isn't get a lot of FTs himself either.
Looks like half the bottom 20 guys are centers. Clogging?
Offensive Rebounding % RAPM
Almost 1/2 positive.
Westbrook makes the first appearance of a backcourt player at 56th.
Mike Dunleavy and Kenyon Martin at 3rd and 4th lowest seem worth noting, the latter moreso based on position.
Turnover % RAPM
A bit more than 1/3 positive.
Kobe #1 here. A benefit I probably wasn't as aware of before this data brought it out.
Iverson pulled a nice enough 30th.
Ming 3rd worst. Is he having a negative indirect effect? Possibly not getting dinged enough by the scorekeepers?
Defense
Effective FG % RAPM
Over 60% are positive, to some degree.
Amir Johnson #1 but traded twice for very little?
AC Law a surprise at #21.
Wally Z. pulled 47th.
Worst? Kevin Martin.
Durant 15th worst- before this season.
FTM/(100 Non-Turnover Possessions) RAPM
Almost 1/2 positive.
Top 40 all front court players- except Tony Parker?
Defensive Rebounding % RAPM
Almost 1/2 positive.
Hayes a mild surprise at #1.
Marreese Speights was 6th lowest.
Westbrook a bit of surprise at 18th lowest on this one.
Turnover % RAPM
Almost 1/2 positive.
Ariza #1.
Finley, Amire, Yao, Shaq Oneal and Bynum in the bottom dozen.
I counted 24 guys above average on all 4 Offensive Factors with Kobe and LeBron the most elite across the board without major weakness. 25 above average on all 4 Defensive Factors.
How many were above average on all 8 Factors?
Just one.
Varejao.
A few others were close.
Last edited by Crow on Fri Nov 27, 2009 12:35 pm; edited 5 times in total |
|
| Back to top |
|
|
back2newbelf
Joined: 21 Jun 2005
Posts: 259
|
| Posted: Fri Nov 27, 2009 5:16 am Post subject: |
|
|
great stuff
| Crow wrote: |
Defensive Rebounding % RAPM
Marreese Speights was 6th lowest.
|
He was also lowest in points scored by the opponent after they had already missed the initial shot |
|
| Back to top |
|
|
Qscience
Joined: 22 Jun 2009
Posts: 69
Location: Phoenix, Arizona
|
| Posted: Fri Nov 27, 2009 11:08 am Post subject: |
|
|
| I thought this was an old post for some reason, as it turned out you did a refreshingly good job on everything. I plan to read it again simply because you laid it out so well. |
|
| Back to top |
|
|
deepak
Joined: 26 Apr 2006
Posts: 664
|
| Posted: Fri Nov 27, 2009 7:04 pm Post subject: |
|
|
Very interesting. I'm looking forward to your time-weighted results also.
Yao is at the 0th percentile for turnovers both on offense and defense according to this analysis. Last season, when Yao played 78 games, Rockets were 29th in turnover% differential. So far this year, they are 8th. So that appears to check out.
But do these numbers explain the huge decline in defensive rebounding for the Rockets? Yao rates very well for his impact on the defensive rebounding according to this analysis, but so do the front court players that are taking most of his minutes this year (Hayes, Landry). And its hard for me to see the Rockets get significantly better on the defensive rebounding this year. Granted, they are looking to run out more in transition which can hurt your DREB%, but without Yao they look to be just outsized around the basket. |
|
| Back to top |
|
|
jsill
Joined: 19 Aug 2009
Posts: 73
|
| Posted: Mon Nov 30, 2009 2:15 pm Post subject: |
|
|
Crow:
Thanks for all the interesting observations. I also noticed that Varejao was the guy who came out best in the sense of having the highest minimum percentile across the 8 dimensions. I thought about writing something about the most "well-rounded" players (as defined by doing OK on all or almost all 8 factors) but I feared being misinterpreted and mocked if I declared Varejao to be the most well-rounded player or the guy with the fewest weaknesses in the league. In one sense, that assertion would be obviously ridiculous, as he's a guy with minimal perimeter skills and a tendency to look a little awkward at times. Nonetheless, according to my results, he doesn't really hurt you along any of those 8 dimensions.
One of the other guys who came out best in the sense of having no major weaknesses in any of the 8 factors is Derek Fisher, which pleased me. Fisher has always seemed like kind of a boring player to me in the sense that he doesn't do a lot that grabs your attention, other than the occasional clutch shot. Nonetheless, he's quietly competent in many facets of the game, so that result made sense to me. |
|
| Back to top |
|
|
jsill
Joined: 19 Aug 2009
Posts: 73
|
| Posted: Mon Nov 30, 2009 2:27 pm Post subject: |
|
|
deepak_e:
Regarding the Rockets and defensive rebounding, I would make two points:
1) It's true that they've had a dropoff in defensive rebounding, but I don't know if I would call it huge. ESPN has their defensive rebounding percentage at 73.3%, which is middle-of-the-pack this year. Last year they finished at 75.3%, which was very good, but behind Boston, Orlando, and San Antonio.
2) My results suggest there should be some defensive rebounding decrease resulting from the switch from Artest (+1.59%) to Ariza (-1.66%). |
|
| Back to top |
|
|
Crow
Joined: 20 Jan 2009
Posts: 806
|
| Posted: Mon Nov 30, 2009 3:28 pm Post subject: |
|
|
You are welcome jsill.
Varejao is about a perfect match to the description: tall/long, mobile, intelligent and tough enough. Odom is another. It is not surprising that a player that is all these things would be good across most or all the 8 Factors. So I'd look for others who might be that, in the right circumstances.
Fisher is reasonably well balanced on the Factors. And yet 1 year and 2 year Adjusted at basketballvalue is much less favorable to him.
I am trying to get out of the habit of just checking one Adjusted rating. If anyone put together that master database of all Adjusted ratings (different models, years, timeframes, splits) that would be a big help. 3, 5,7 or more different estimates may be a more useful way to look at players.
I would think that Adjusted Factor level data would be quite useful in constructing top performing lineups and teams given role splits that occur based on positions players take on the court and available skill-level distributions and which positions those guys can guard adequately. |
|
| Back to top |
|
|
Crow
Joined: 20 Jan 2009
Posts: 806
|
| Posted: Mon Nov 30, 2009 10:36 pm Post subject: |
|
|
The 4 Factors aren't equally important but the overall RAPM handles that. Looking at the sum of 4 Factor rankings, for what is says about a player's balance and relative balance I see that the median player's sum of 4 Factor rankings is real close to 200 (50th percentile *4).
250 makes you top quartile and Fisher slides in just above that.
300 makes you elite on balance:
Rank Player Overall RAPM Sum 4Factors
5 LeBron James 6.046 362
4 Kobe Bryant 7.051 360
17 Chris Paul 5.528 355
48 Antawn Jamison 4.125 341
15 Dirk Nowitzki 5.652 339
19 Carmelo Anthony 4.126 338
29 Chauncey Billups 5.124 335
33 Paul Pierce 4.16 328
53 Joe Johnson 3.227 327
16 Vince Carter 4.371 323
11 Dwyane Wade 4.622 316
25 Chris Bosh 3.439 315
54 Jason Kidd 3.247 315
37 Michael Redd 3.289 313
49 Brandon Roy 3.386 310
66 LaMarcus Aldridge 3.444 308
35 J.R. Smith 2.747 303
44 Rudy Gay 2.501 303
170 Gilbert Arenas 2.074 301
For those 300+ on balance none are less than 40th percentile on any Factor.
But 13 of the top 20 on overall RAPM aren't top 20 on balance so it isn't necessary to be a top guy and most don't miss 300 by much but in a few cases the lower balance rating is worth noting:
Rank Player Overall RAPM Sum 4Factors
8 Deron Williams 4.344 299
13 Kevin Garnett 3.394 298
9 Tim Duncan 3.531 296
10 Pau Gasol 3.468 292
6 Dwight Howard 2.992 290
7 Hedo Turkoglu 3.921 267
20 Amare Stoudemire2.662 267
1 Steve Nash 7.124 266
3 Rashard Lewis 4.265 266
14 Leandro Barbosa 3.805 264
2 Ray Allen 3.79 237
12 Shaquille O'Neal 1.234 197
18 Raja Bell 1.742 194 |
|
| Back to top |
|
|
RChung
Joined: 28 Nov 2009
Posts: 10
|
| Posted: Tue Dec 01, 2009 5:37 pm Post subject: |
|
|
| Crow wrote: | | The 4 Factors aren't equally important but the overall RAPM handles that. |
 |
|
| Back to top |
|
|
Crow
Joined: 20 Jan 2009
Posts: 806
|
| Posted: Wed Dec 02, 2009 3:20 am Post subject: |
|
|
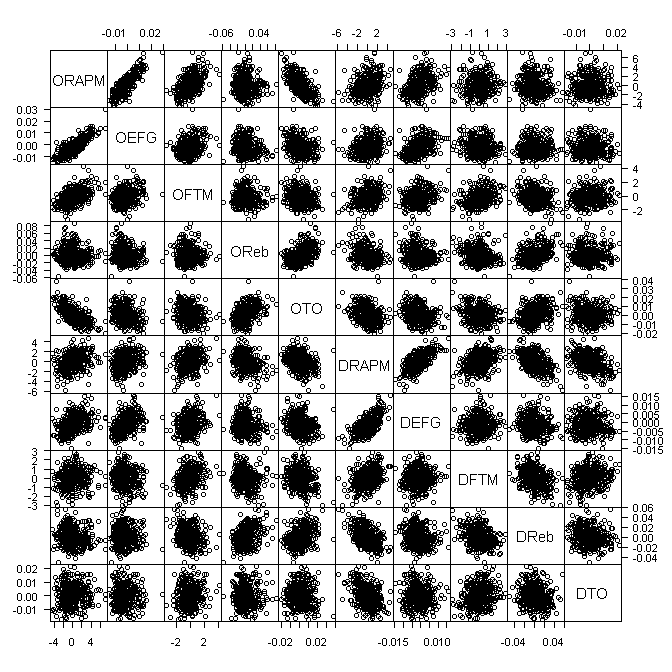
You condensed a lot of information into the first chart. The orientation of the data clouds gives one level of information about the general trend of the relationship between the 2 Factors (or one with the overall RAPM).
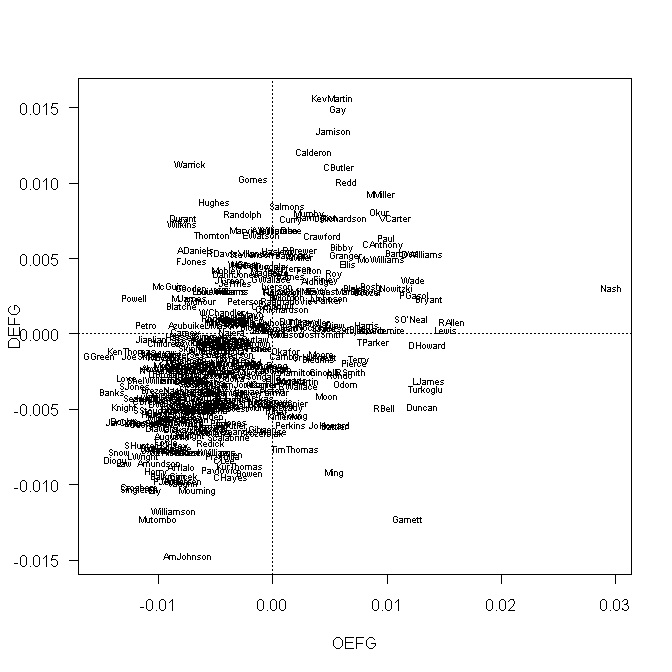
A chart like chart 2 (a singe cell from the first chart) is useful in seeing at least the guys at the edges. A much much bigger blowup (and maybe something more to stack and display them) would be needed to see more of the players clearly.
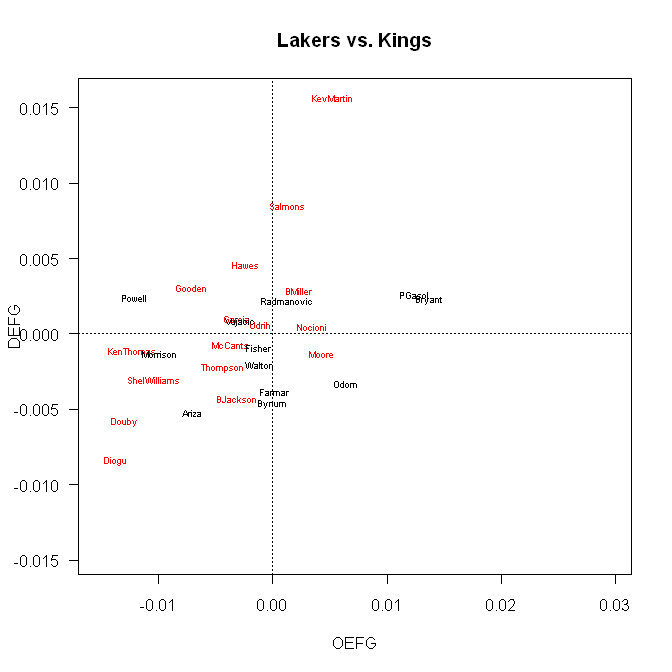
With chart 3 you've demonstrated another way to use the information. Player match-ups could also be done.
If you want to provide bigger versions of the detail from chart 1 or what you noticed about them I would read it.
Thanks for showing interest in jsill's data.
I could also see deriving average 4 Factor profiles by say quartiles and further splits by position, age, salary or other criteria. |
|
| Back to top |
|
|
RChung
Joined: 28 Nov 2009
Posts: 10
|
| Posted: Wed Dec 02, 2009 12:39 pm Post subject: |
|
|
| Crow wrote: | | A chart like chart 2 (a singe cell from the first chart) is useful in seeing at least the guys at the edges. [...] With chart 3 you've demonstrated another way to use the information. |
JSill's data didn't have minutes played or player positions and I was too lazy to dig them up but the obvious thing to do (especially for the third type of chart) is to scale the size of the names by minutes played (which is a continuous variable) and to color-code by position (which is a categorical variable). |
|
| Back to top |
|
|
jsill
Joined: 19 Aug 2009
Posts: 73
|
| Posted: Wed Dec 02, 2009 7:06 pm Post subject: |
|
|
RChung:
Thanks for creating all those interesting scatter plots of the four factors results. It's interesting that OReb vs. ORAPM looks pretty much like a random blob without much orientation. I think this is (in part) because there a lot of somewhat clumsy bruiser types like Reggie Evans who are great on the offensive boards but can't shoot and are turnover-prone.
By the way, I can get you minutes-played numbers fairly easily if you want them. |
|
| Back to top |
|
|
|

