| View previous topic :: View next topic |
| Author |
Message |
Crow
Joined: 20 Jan 2009
Posts: 812
|
 Posted: Thu Dec 03, 2009 4:03 am Post subject: Posted: Thu Dec 03, 2009 4:03 am Post subject: |
 |
|
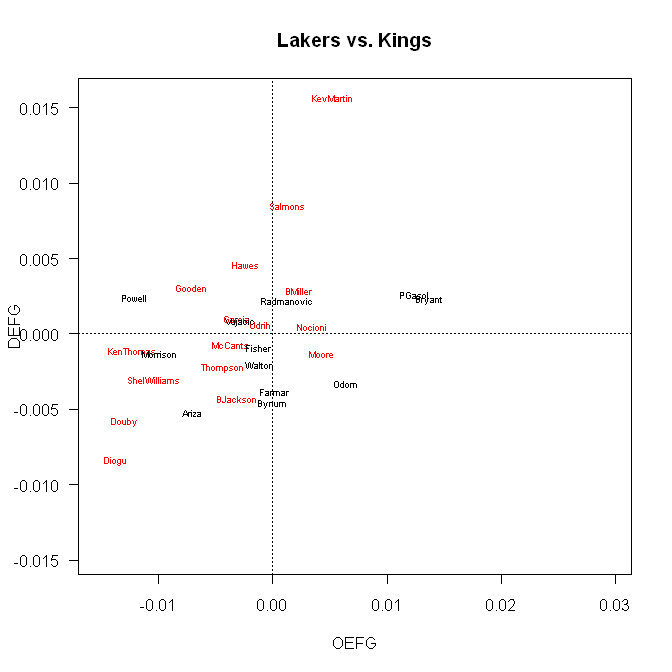
A few more data bits I noticed:
Effective FG % RAPM
Ariza nearly in the bottom quartile.
Brook Lopez bottom third.
Tim Thomas, Felton top fifth.
Radmanovic top quarter.
Raja Bell top 5%.
The direct individual stats don't explain these rankings very much. Team effects, negative and positive, must be pretty large. Accurate or outlier. |
|
| Back to top |
|
 |
RChung
Joined: 28 Nov 2009
Posts: 10
|
 Posted: Fri Dec 04, 2009 9:56 am Post subject: Posted: Fri Dec 04, 2009 9:56 am Post subject: |
 |
|
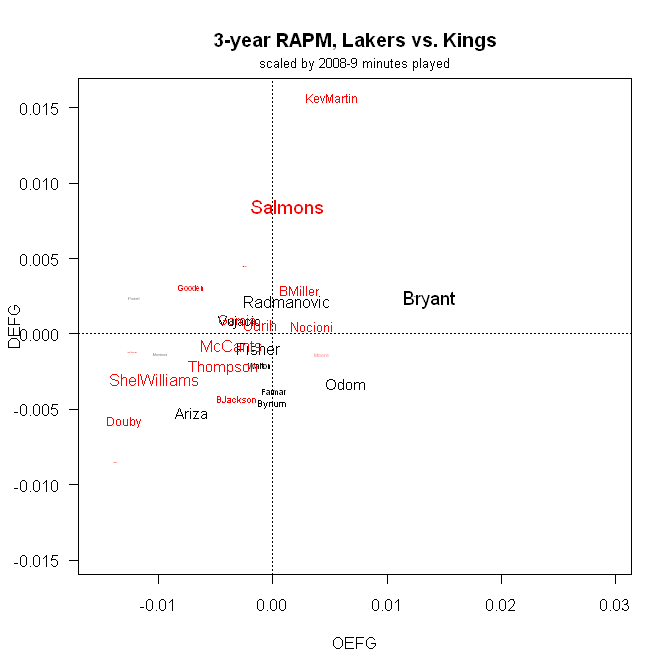
Repeated from previous post:

Scaled by 2008-9 minutes played:
 |
|
| Back to top |
|
 |
Ed Küpfer
Joined: 30 Dec 2004
Posts: 785
Location: Toronto
|
 Posted: Fri Dec 04, 2009 1:21 pm Post subject: Posted: Fri Dec 04, 2009 1:21 pm Post subject: |
 |
|
I love those graphs.
_________________
ed |
|
| Back to top |
|
 |
Ryan J. Parker
Joined: 23 Mar 2007
Posts: 711
Location: Raleigh, NC
|
 Posted: Fri Dec 04, 2009 1:23 pm Post subject: Posted: Fri Dec 04, 2009 1:23 pm Post subject: |
 |
|
| Ed Küpfer wrote: | | I love those graphs. |
I really like how you can't read the names of players that we probably shouldn't be making a fuss over.
_________________
I am a basketball geek. |
|
| Back to top |
|
 |
RChung
Joined: 28 Nov 2009
Posts: 10
|
 Posted: Fri Dec 04, 2009 2:29 pm Post subject: Posted: Fri Dec 04, 2009 2:29 pm Post subject: |
 |
|
| Ryan J. Parker wrote: | | I really like how you can't read the names of players that we probably shouldn't be making a fuss over. |
Well, in that case maybe I should've disappeared the entire 2008-9 Kings roster. But, yeah, that's exactly the reason why one might want to scale by minutes played. |
|
| Back to top |
|
 |
cherokee_ACB
Joined: 22 Mar 2006
Posts: 157
|
 Posted: Fri Dec 04, 2009 3:02 pm Post subject: Posted: Fri Dec 04, 2009 3:02 pm Post subject: |
 |
|
| Ed Küpfer wrote: | | I love those graphs. |
Everyone loves Chung Charts.
Last edited by cherokee_ACB on Fri Dec 04, 2009 3:43 pm; edited 1 time in total |
|
| Back to top |
|
 |
Crow
Joined: 20 Jan 2009
Posts: 812
|
 Posted: Fri Dec 04, 2009 3:35 pm Post subject: Posted: Fri Dec 04, 2009 3:35 pm Post subject: |
 |
|
If I was a coach I'd want the chart converted into a table of the differences between the OEFG and DEFG for the several most likely match-ups to help with consideration of which match-ups to try hardest to get shots up on offense and where to be more selective or creative. And it would provide a defensive overview and would probably affect strategy there too.
Of course now that we have Adjusted EFG, I'd push for Adjusted Inside, Mid-Range and 3 pt FG measures. For more clues. Imperfect but often helpful . |
|
| Back to top |
|
 |
RChung
Joined: 28 Nov 2009
Posts: 10
|
 Posted: Fri Dec 04, 2009 8:31 pm Post subject: Posted: Fri Dec 04, 2009 8:31 pm Post subject: |
 |
|
| cherokee_ACB wrote: | | Ed Küpfer wrote: | | I love those graphs. |
Everyone loves Chung Charts. |
Kids, don't try this at home. |
|
| Back to top |
|
 |
|