 |
APBRmetrics
The statistical revolution will not be televised.
|
| View previous topic :: View next topic |
| Author |
Message |
cherokee_ACB
Joined: 22 Mar 2006
Posts: 157
|
 Posted: Fri Jul 06, 2007 2:39 am Post subject: Posted: Fri Jul 06, 2007 2:39 am Post subject: |
 |
|
Basketballvalue data is great for this kind of analysis. By my count, Renaldo played at most 239 garbage minutes (defined as 'diff >= 20 || dif >= 15 && Q >=3 || dif >=10 && Q==4' when the playing stint starts). In that time, the Knicks did much better(99.7 - 91.4 points per 100 possessions) than in Renaldo non-garbage time (96.6 - 100.2). BV overstimates possessions, so these numbers do not match 82games numbers, but they anyway support the theory that Balkman net +/- was helped by garbage time, but New York defense was still better with Renaldo on court (106.5 when off court).
Edit: there was a mistake in the numbers I reported first, sorry. Fixed now, with a different conclusion. |
|
| Back to top |
|
 |
cherokee_ACB
Joined: 22 Mar 2006
Posts: 157
|
| Posted: Fri Jul 06, 2007 3:30 am Post subject: |
|
|
And if I designate 5 (sometimes 6) starters in each NBA roster, this is the breakdown of the units Balkman faced. "#St." is the number of starters in the unit.
| Code: |
#St. Time% OfEff DfEff
0 6% 89.7 64.7
1 12% 96.1 90.3
2 25% 95.1 91.3
3 31% 97.4 101.7
4 22% 101.7 114.9
5 4% 92.9 90.5
|
On average, he played against 2.64 starters. I wonder if this matches MikeG estimations. Note that I'm not using the actual starters in each game. I've chosen the most common ones instead, but the difference shouldn't be big. |
|
| Back to top |
|
|
Mike G
Joined: 14 Jan 2005
Posts: 3630
Location: Hendersonville, NC
|
| Posted: Fri Jul 06, 2007 5:07 am Post subject: |
|
|
My formula estimates 45% vs starters; 2.64/5.00 = 53%
If you designate 6 opponents as 'starters', then that might make the difference. Or it may be that 'defensive specialists' are used vs starters more.
Here's that formula for % of opponents who were starter-caliber:
%St = GS/G *(1-.333*mpg/48.5) + (1-GS/G)*.333*(1+mpg/48.5)
48.5 stands for average minutes in a game. (Actually 48.45 this year)
.333, or 1/3, is the league average fraction of the game taken by a non-starter at the position, for regular season. This does not seem to change (until playoffs).
The first half of the equation is for games started; the 2nd half for games off the bench. Unless a head coach has some peculiar substitution patterns, I believe this formula closely approximates actual St%.
_________________
`
36% of all statistics are wrong |
|
| Back to top |
|
|
cherokee_ACB
Joined: 22 Mar 2006
Posts: 157
|
| Posted: Fri Jul 06, 2007 7:37 am Post subject: |
|
|
| Mike G wrote: | My formula estimates 45% vs starters; 2.64/5.00 = 53%
If you designate 6 opponents as 'starters', then that might make the difference.
|
6 starters was for special cases. Stojakovic injury, Blake and J.R. Smith at Denver, and I think that's it (edit: well, I had forgotten O'Neal & Mourning). In fact, by designating just 5 starters per roster, I'm probably understimating the number of opponent starters on court, given all the injuries last season.
Last edited by cherokee_ACB on Fri Jul 06, 2007 10:01 am; edited 1 time in total |
|
| Back to top |
|
|
Flint
Joined: 25 Mar 2007
Posts: 112
|
| Posted: Fri Jul 06, 2007 9:29 am Post subject: |
|
|
| Good post Ben. I agree with that. My impression from having watched pretty much every Balkman game, was that when he played it was real minutes. |
|
| Back to top |
|
|
cherokee_ACB
Joined: 22 Mar 2006
Posts: 157
|
| Posted: Fri Jul 06, 2007 1:51 pm Post subject: |
|
|
| Mike G wrote: |
%St = GS/G *(1-.333*mpg/48.5) + (1-GS/G)*.333*(1+mpg/48.5)
|
I've long suspected that your formula underestimated %St for non-starters, and Balkman has given me a great opportunity to verify it. Using again basketballvalue data, I've done some number-crunching, and these are the results:
- Regression using game data
%St(starters) = .900 - .220*minutes/48.5
%St(bench) = .389 + .283*minutes/48.5
- (Non-weighted) Regression using season data
%St(starters) = .893 - .234*mpg/48.5
%St(bench) = .374 + .371*mpg/48.5
Here, mpg is the average when starting or coming from the bench respectively, and not the overall season average that you use in your formula.
If I were in the mood to work with R, I would run the weighted regressions and a multiple regression based on your formula. But it's Friday, I'm lazy and, anyway, I don't think the conclusion would differ much: that your formula, while providing a good estimation, tends to favor starters over bench players.
PS: by the way, Balkman's actual %St was 51.6% |
|
| Back to top |
|
|
Mike G
Joined: 14 Jan 2005
Posts: 3630
Location: Hendersonville, NC
|
| Posted: Sat Jul 07, 2007 7:24 am Post subject: |
|
|
That formula is indeed a simplistic one, with much room for variation among players' substitution patterns. It assumes a game has stages, starting at 100% starters (duh) and devolving linearly to 33%. A sub is more likely to enter in the 33% phase.
Here's a chart of minutes and St% for a player who starts; whether for 82 games or just this one game.
| Code: | Min %St
48 .670
40 .725
32 .780
24 .835
16 .890
8 .945
0 1.000
|
The guy who starts but leaves in the first minutes played against 100% St.
The 48-minute player went against 2/3 St and 1/3 subs. (He doesn't do overtimes.)
Now for subs:
| Code: | Min %St
48 .663
40 .608
32 .553
24 .498
16 .443
8 .388
0 .333
|
At top is a guy who came in during the first minute and played the rest of the game. His St% approaches that 2/3 mark of the starter who went 48.
The 29-second appearance at bottom, if it occurred at a random point in the game, should be .667 . But the formula doesn't assume randomness. It assumes opposing teams tend to substitute in parallel, even emptying the benches at times. In those cases, .333 is too high.
The first chart, for starters, should be about right. The second (subs) has some major assumptions. But for a team, the sum of players' starter-opponent-minutes [5*St%*Min] comes out equal to (2/3)*5*Min for the team. This is as it should be. Where is the departure from theory?
If Balkman is estimated at 45%, when really he's 52%, that's within the range of coaching quirkiness and team constitution/utility. Someone else must be getting less than their estimated St%.
How much difference is there when you assume a player's mpg as a starter are = those as a sub? (vs assuming he's always going 16 min)
_________________
`
36% of all statistics are wrong |
|
| Back to top |
|
|
cherokee_ACB
Joined: 22 Mar 2006
Posts: 157
|
| Posted: Sun Jul 08, 2007 11:30 am Post subject: |
|
|
| Mike G wrote: |
The first chart, for starters, should be about right. The second (subs) has some major assumptions. But for a team, the sum of players' starter-opponent-minutes [5*St%*Min] comes out equal to (2/3)*5*Min for the team. This is as it should be. Where is the departure from theory?
|
The problem is that your formula is perfect for the extreme cases - those starters that play 0 or 48 mpg- but not so much for all other players. A regression gives instead the best fit for the area of interest. I finally did the weighted regressions, with these results
- Regression using season data, weighted by games played
%St(starters) = .885 - .207*mpg/48.5
%St(bench) = .390 + .324*mpg/48.5
Again, these are minutes played when starting (or not), not season averages.
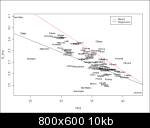
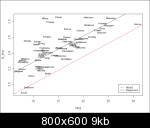
If you compare those expressions with your formula, you'll see that, while the difference isn't big, you overestimate %St for starters, and underestimate it, by around 10%, for bench players. Take a look at the plots, which show the actual average number of starters the most representative players faced during the season (the left one contains starters, the second one bench players)
By the way, the correlations were -0.66 and 0.69, significant enough I'd say.
Now, what do we do with those players that sometimes start, sometime don't? I ran the regression with GS/G, mpg (the season average) and GS/G*mpg as parameters. The result was:
| Code: |
Coefficients:
Estimate Std. Error t value Pr(>|t|)
(Intercept) 0.4058447 0.0064754 62.67 <2e-16
mpg 0.0051424 0.0003793 13.56 <2e-16
GS/G*mpg -0.0119153 0.0005525 -21.57 <2e-16
GS/G 0.5693178 0.0168506 33.79 <2e-16
Residual standard error: 0.2497 on 453 degrees of freedom
Multiple R-Squared: 0.9099, Adjusted R-squared: 0.9093
|
In terms of MikeG's formula, it would become:
%St = GS/G * (.975 - .329*mpg/48.5) + (1 - GS/G) * (.406 + .249*mpg/48.5) |
|
| Back to top |
|
|
Mike G
Joined: 14 Jan 2005
Posts: 3630
Location: Hendersonville, NC
|
| Posted: Mon Jul 09, 2007 8:05 am Post subject: |
|
|
Quite fascinating work you've done here, sir.
| cherokee_ACB wrote: | | ... your formula is perfect for the extreme cases - those starters that play 0 or 48 mpg- but not so much for all other players... |
Hmm... So if the ends are right, but the middles are not, then it must not be a straight-line relationship? Conversely, if you have different intercepts (and a linear fit), then your extremes have to be off?
If we go with an inverted S-curve (for your 'starters' chart), which from left to right drops most steeply around 36 minutes, we can still have my (.33 and .67, or 1.6 and 3.4) endpoints, no?
On the 'bench' chart, an S-curve that inflects upward around 12 minutes looks about right. Would these be a cube-root, plus intercept?
I can't read all the names, but are high-fouling players well represented among those much below the curve for starters? Also among those below the curve for subs? And why are all Pistons above the curve? Their opponents didn't use their subs very much?
_________________
`
36% of all statistics are wrong |
|
| Back to top |
|
|
cherokee_ACB
Joined: 22 Mar 2006
Posts: 157
|
| Posted: Sun Jul 15, 2007 12:44 pm Post subject: |
|
|
| Mike G wrote: |
If we go with an inverted S-curve (for your 'starters' chart), which from left to right drops most steeply around 36 minutes, we can still have my (.33 and .67, or 1.6 and 3.4) endpoints, no?
On the 'bench' chart, an S-curve that inflects upward around 12 minutes looks about right. Would these be a cube-root, plus intercept? |
I'm not sure what you mean by an S-curve. Honestly, I don't see it there. The starters plot, in particular, looks reasonably linear. I've tested some basic functions and all I can get is a marginal increase in the correlation coefficient over the linear regression.
| Quote: | | I can't read all the names, but are high-fouling players well represented among those much below the curve for starters? Also among those below the curve for subs? And why are all Pistons above the curve? Their opponents didn't use their subs very much? |
I can't identify any pattern in the data, other than some teams, as you say, play against more starters than others. I guess that's something that can be verified from boxscore data. |
|
| Back to top |
|
|
|
|
You cannot post new topics in this forum
You cannot reply to topics in this forum
You cannot edit your posts in this forum
You cannot delete your posts in this forum
You cannot vote in polls in this forum
|
Powered by phpBB © 2001, 2005 phpBB Group
|


