| View previous topic :: View next topic |
| Author |
Message |
Jon Nichols
Joined: 18 Aug 2005
Posts: 370
|
 Posted: Wed Nov 25, 2009 3:19 pm Post subject: Looking at Defensive Rating vs. Age Posted: Wed Nov 25, 2009 3:19 pm Post subject: Looking at Defensive Rating vs. Age |
 |
|
This probably has been done before, but I examined how the average Defensive Rating for all players varies with age. I used data from the past five seasons, and got my numbers from B-R.
The article is here:
http://basketball-statistics.com/blog1/2009/11/25/does-defense-get-better-with-age/
Basically, I found that Defensive Ratings are lower on average for older players. That is, for all positions except point guards. Of course, there are a number of precautions to take when looking at the figures, and I mention them in the article... |
|
| Back to top |
|
 |
Mike G
Joined: 14 Jan 2005
Posts: 3578
Location: Hendersonville, NC
|
 Posted: Wed Nov 25, 2009 3:31 pm Post subject: Posted: Wed Nov 25, 2009 3:31 pm Post subject: |
 |
|
Fortunately I read the article before making this suggestion, which was added at the end: | Quote: | | Although there is a correlation between age and Defensive Rating, that doesn’t mean it’s a causal relationship. It may not be that all older players are better defenders. Perhaps the only way to stay in the league if you’re getting older is to play solid defense, so the ones that don’t are selectively removed. Or maybe strong defensive teams like to acquire veterans, which boosts those player’s Defensive Ratings. |
You'd about have to track individual players' yearly improvements in DRtg to get to the bottom of this. And then you'd still have the quandary stated in the last sentence.
Point guards don't play better defense as they age: Defense isn't their primary job, most of the time. Steve Nash probably plays less defense (!) to run the offense these days.
I wonder if you get smoother curves when you weigh by minutes, rather than count everyone (>500 min) the same.
Win Score or Win Shares?
_________________
`
36% of all statistics are wrong |
|
| Back to top |
|
 |
Jon Nichols
Joined: 18 Aug 2005
Posts: 370
|
 Posted: Wed Nov 25, 2009 3:49 pm Post subject: Posted: Wed Nov 25, 2009 3:49 pm Post subject: |
 |
|
| Quote: | | You'd about have to track individual players' yearly improvements in DRtg to get to the bottom of this. And then you'd still have the quandary stated in the last sentence. |
You are not the first to suggest this...
| Quote: | I wonder if you get smoother curves when you weigh by minutes, rather than count everyone (>500 min) the same.
|
I could try that as well.
| Quote: | | Win Score or Win Shares? |
Win Shares, I believe. |
|
| Back to top |
|
 |
Kevin Pelton
Site Admin
Joined: 30 Dec 2004
Posts: 978
Location: Seattle
|
 Posted: Wed Nov 25, 2009 5:15 pm Post subject: Posted: Wed Nov 25, 2009 5:15 pm Post subject: |
 |
|
| The other possibility to account for selection bias would be looking only at players with full NBA careers. That would limit your sample size quite a bit. |
|
| Back to top |
|
 |
Jon Nichols
Joined: 18 Aug 2005
Posts: 370
|
 Posted: Wed Nov 25, 2009 5:24 pm Post subject: Posted: Wed Nov 25, 2009 5:24 pm Post subject: |
 |
|
I updated the article, and it shows there was a selection bias. The average change in Defensive Rating is larger for older players (or we can at least say with confidence it's not lower) than it is for younger ones.
So older players as a whole have better Defensive Ratings, but not because they're getting better as they get older. They're actually getting worse. |
|
| Back to top |
|
 |
Ryan J. Parker
Joined: 23 Mar 2007
Posts: 708
Location: Raleigh, NC
|
 Posted: Wed Nov 25, 2009 5:35 pm Post subject: Posted: Wed Nov 25, 2009 5:35 pm Post subject: |
 |
|
What did you fit that line to? The mean difference at each point? Can you create a scatter plot for the differences for all players so we that looks like? Surely there are some negatives in there.
_________________
I am a basketball geek. |
|
| Back to top |
|
 |
Jon Nichols
Joined: 18 Aug 2005
Posts: 370
|
 Posted: Wed Nov 25, 2009 5:41 pm Post subject: Posted: Wed Nov 25, 2009 5:41 pm Post subject: |
 |
|
| Ryan J. Parker wrote: | | What did you fit that line to? The mean difference at each point? Can you create a scatter plot for the differences for all players so we that looks like? Surely there are some negatives in there. |
Yes, the line is fit to the mean difference at each point. The points are visible on the graph, they're just a little harder to see than normal because of the lines connecting them.
There are two negatives: at ages 20 and 34. Most of them are positive though because offense has increased during each of the last 5 years. |
|
| Back to top |
|
 |
Ryan J. Parker
Joined: 23 Mar 2007
Posts: 708
Location: Raleigh, NC
|
 Posted: Wed Nov 25, 2009 5:55 pm Post subject: Posted: Wed Nov 25, 2009 5:55 pm Post subject: |
 |
|
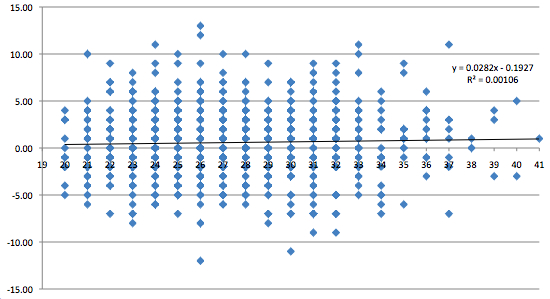
I'm referring to a per player basis. I'd like to see a scatter plot showing all player differences. That's also what you'd want to fit the line to.
_________________
I am a basketball geek. |
|
| Back to top |
|
 |
Jon Nichols
Joined: 18 Aug 2005
Posts: 370
|
 Posted: Wed Nov 25, 2009 6:05 pm Post subject: Posted: Wed Nov 25, 2009 6:05 pm Post subject: |
 |
|
Oh, I see. Here you go:
 |
|
| Back to top |
|
 |
Ryan J. Parker
Joined: 23 Mar 2007
Posts: 708
Location: Raleigh, NC
|
 Posted: Wed Nov 25, 2009 6:12 pm Post subject: Posted: Wed Nov 25, 2009 6:12 pm Post subject: |
 |
|
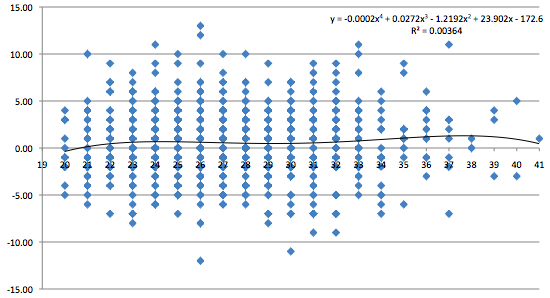
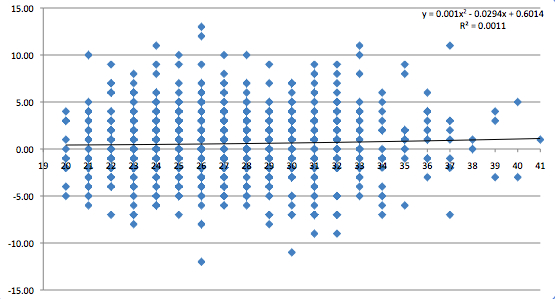
Is it possible to fit a quadratic? Like y = b0 + b1 * age + b2 * age^2?
_________________
I am a basketball geek. |
|
| Back to top |
|
 |
Jon Nichols
Joined: 18 Aug 2005
Posts: 370
|
 Posted: Wed Nov 25, 2009 6:36 pm Post subject: Posted: Wed Nov 25, 2009 6:36 pm Post subject: |
 |
|
Yes. I'm far from an expert at this, but based on what I know how to do with Excel, a 4th order polynomial produced the highest R^2 (that is, still a very low one):
 |
|
| Back to top |
|
 |
Ryan J. Parker
Joined: 23 Mar 2007
Posts: 708
Location: Raleigh, NC
|
 Posted: Wed Nov 25, 2009 6:39 pm Post subject: Posted: Wed Nov 25, 2009 6:39 pm Post subject: |
 |
|
Yeah I wouldn't fit anything over a quadratic. Just interested to see if you can detect an aging curve.
_________________
I am a basketball geek. |
|
| Back to top |
|
 |
Jon Nichols
Joined: 18 Aug 2005
Posts: 370
|
 Posted: Wed Nov 25, 2009 6:49 pm Post subject: Posted: Wed Nov 25, 2009 6:49 pm Post subject: |
 |
|
| Ryan J. Parker wrote: | | Yeah I wouldn't fit anything over a quadratic. Just interested to see if you can detect an aging curve. |
Here's the quadratic, FYI:
 |
|
| Back to top |
|
 |
Kevin Pelton
Site Admin
Joined: 30 Dec 2004
Posts: 978
Location: Seattle
|
 Posted: Wed Nov 25, 2009 7:32 pm Post subject: Posted: Wed Nov 25, 2009 7:32 pm Post subject: |
 |
|
| So to be clear, the results show that players peak defensively as rookies? That is certainly not CW. I think it is possible that tracked defensive statistics tend to degrade quickly, but that the untracked (by the box score) portions of defense improve. |
|
| Back to top |
|
 |
Jon Nichols
Joined: 18 Aug 2005
Posts: 370
|
 Posted: Wed Nov 25, 2009 8:07 pm Post subject: Posted: Wed Nov 25, 2009 8:07 pm Post subject: |
 |
|
| Kevin Pelton wrote: | | So to be clear, the results show that players peak defensively as rookies? That is certainly not CW. I think it is possible that tracked defensive statistics tend to degrade quickly, but that the untracked (by the box score) portions of defense improve. |
Based on the initial graphs, I would have said 23. And if you're looking at improvements on a year-to-year basis, I would still say around that age because even though they're Defensive Rating is getting higher at that point, the League Average as a whole is getting higher. Henry Abbott suggested I compare the change to the league change to get a clearer picture, so I'll do that soon. |
|
| Back to top |
|
 |
|