| View previous topic :: View next topic |
| Author |
Message |
Eli W
Joined: 01 Feb 2005
Posts: 402
|
|
| Back to top |
|
 |
Ryan J. Parker
Joined: 23 Mar 2007
Posts: 708
Location: Raleigh, NC
|
 Posted: Wed Mar 18, 2009 10:22 am Post subject: Posted: Wed Mar 18, 2009 10:22 am Post subject: |
 |
|
Gelman's analysis caught my eye this morning. I love this stuff. Right or wrong, this is a great learning tool when really smart people analyze this kinda thing.
_________________
I am a basketball geek. |
|
| Back to top |
|
|
Guy
Joined: 02 May 2007
Posts: 128
|
| Posted: Wed Mar 18, 2009 10:40 am Post subject: |
|
|
| Does anyone here know of NBA data that would show if the same pattern occurs there? Ed K. posted some data on win% at various minute/score states a while back, but the link is now broken. |
|
| Back to top |
|
|
Ed Küpfer
Joined: 30 Dec 2004
Posts: 785
Location: Toronto
|
| Posted: Wed Mar 18, 2009 2:17 pm Post subject: |
|
|
I wish I could help. The original data is gone, disappeared on a long lost hard drive. I now have newer, better data, which I am obviously not allowed to give out.
I can tell you this: my original dataset came from NBA.com play by plays. You can recreate this by using the data provided at basketballvalue. In fact, it will be much better since their data is much cleaner than the stuff I used. I don't know how hard it would be to do this, but if I can do it, anyone can do it in half the time.
_________________
ed |
|
| Back to top |
|
|
Guy
Joined: 02 May 2007
Posts: 128
|
| Posted: Wed Mar 18, 2009 3:34 pm Post subject: |
|
|
| Ed: Can you just tell us how often teams win when they lead by 1 point at the half? Surely that isn't a proprietary figure. :>) |
|
| Back to top |
|
|
Ed Küpfer
Joined: 30 Dec 2004
Posts: 785
Location: Toronto
|
| Posted: Wed Mar 18, 2009 4:01 pm Post subject: |
|
|
I found some old data that may be helpful. Home team halftime leads and eventual wins, games from 1992 to 2002. (The 20 point leads and deficits, I'm not sure if they mean actual 20 points or 20+ points.)
| Code: | lead wins games
-20 0 43
-19 4 55
-18 5 67
-17 6 72
-16 4 81
-15 14 117
-14 18 118
-13 32 155
-12 39 164
-11 38 221
-10 63 236
-9 64 246
-8 112 311
-7 113 364
-6 120 324
-5 147 386
-4 175 401
-3 190 395
-2 241 479
-1 255 460
0 271 497
1 296 509
2 289 483
3 322 500
4 335 513
5 315 438
6 372 462
7 331 424
8 311 377
9 293 358
10 296 355
11 293 336
12 266 287
13 245 279
14 205 231
15 207 221
16 169 184
17 178 185
18 135 140
19 115 116
20 102 105
|
_________________
ed |
|
| Back to top |
|
|
Serhat Ugur (hoopseng)
Joined: 13 Oct 2006
Posts: 208
Location: Basketball Research
|
| Posted: Wed Mar 18, 2009 4:11 pm Post subject: |
|
|
last season it is 52-56. (trailing by 1 and win the game)
this season it is 38-47
_________________
http://www.nbastuffer.com
Last edited by Serhat Ugur (hoopseng) on Wed Mar 18, 2009 4:27 pm; edited 1 time in total |
|
| Back to top |
|
|
Guy
Joined: 02 May 2007
Posts: 128
|
| Posted: Wed Mar 18, 2009 4:24 pm Post subject: |
|
|
| Thanks, Ed. Very helpful. |
|
| Back to top |
|
|
Mike G
Joined: 14 Jan 2005
Posts: 3552
Location: Hendersonville, NC
|
| Posted: Thu Mar 19, 2009 6:11 am Post subject: |
|
|
I'm guessing Ed's data must be referring to the halftime status of the home team. A halftime tie is won 56% of the time by somebody, eh?. Likewise:
| Code: | lead win
+20 .982
+15 .914
+10 .841
+5 .723
0 .561
-5 .398
-10 .235
-15 .114
-20 .041
|
In each case, this team does much better in the 2nd half; and a halftime deficit is much worse for the 'other' team.
_________________
`
36% of all statistics are wrong |
|
| Back to top |
|
|
Guy
Joined: 02 May 2007
Posts: 128
|
| Posted: Thu Mar 19, 2009 9:45 am Post subject: |
|
|
| Hoopseng: Is that data for all teams, or home teams only? |
|
| Back to top |
|
|
schtevie
Joined: 18 Apr 2005
Posts: 408
|
| Posted: Thu Mar 19, 2009 10:41 am Post subject: |
|
|
The paper is cute, but I don't find it that interesting from a basketball perspective. And apparently not at all from an NBA perspective.
Given Ed's data, and the familiar home court advantage of between 3 to 4 points - call it half that at halftime, it would seem that, lo and behold, home teams down 2 points at the half win....half their games (241 out of 479). Maybe this has something to do the attitudes of professionals vs. amateurs. Lack of rah, rah, and all that.
More generally, It would have been interesting if the study had included corroborating analysis of overtime games. According to their set-up, as I understand it, a game that ends in a tie is actually a very slight notional deficit for the away team, given the generally accepted existence of the home court advantage, and it should invoke their relatively greater effort. It would have been nice confirmation to see away teams winning more than 50% of OT games. Maybe it is so, maybe it isn't. |
|
| Back to top |
|
|
Guy
Joined: 02 May 2007
Posts: 128
|
| Posted: Thu Mar 19, 2009 11:21 am Post subject: |
|
|
| Actually, the NBA data provides partial support. In Ed's data, and more recent data compiled by Mitchell Lichtman, it appears that HOME teams down one at the half win more than they should. They win about as frequently (slightly more) than in tie games. (Alternatively, road teams up by one at the half win less than they should.) Road teams do not show this -1 effect. See the 2nd link in Eli's original post above for discussion of this at The Book blog. |
|
| Back to top |
|
|
Ed Küpfer
Joined: 30 Dec 2004
Posts: 785
Location: Toronto
|
| Posted: Thu Mar 19, 2009 12:27 pm Post subject: |
|
|
Okay, I went ahead and did some more work on this. By incorporating the home and away teams' win percentage, I calcuated the home team win probabilty (log5) for each game in the old data I have. I created a histogram of home team half time leads, binned by the probability of the home team winning the game.
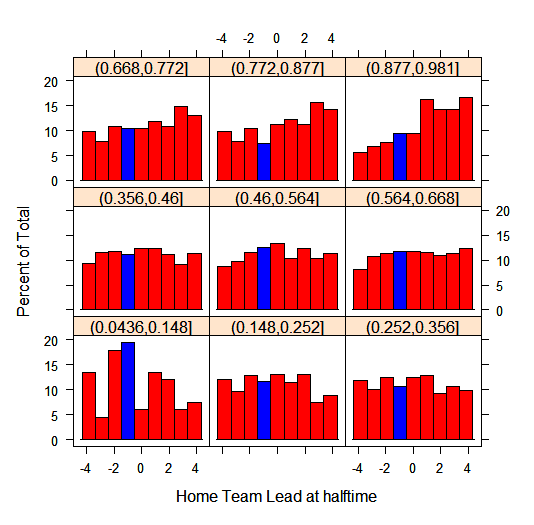
For some reason, "home team down one at the half" games are overrepresented when the home team is playing a far superior opponent.
Next home team win percentages by lead at the half, again binned by log5:
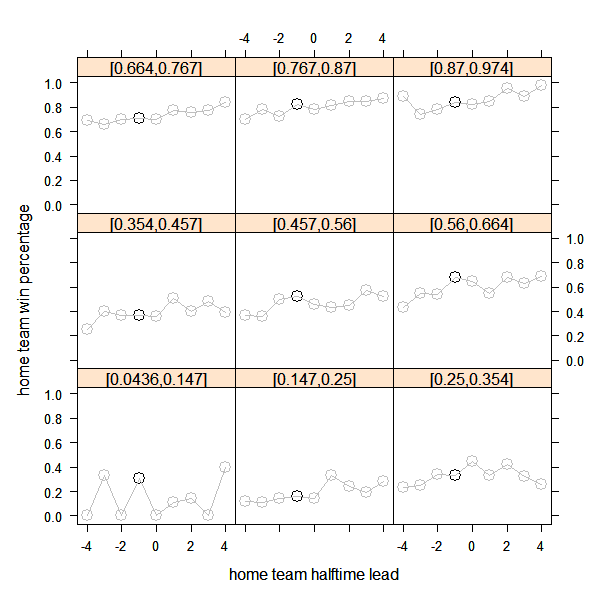
Nothing looks out of line there. It appears that once you take relative team strengths into account, home teams down one at the half win about as much as they're supposed to.
_________________
ed |
|
| Back to top |
|
|
ecumenopolis0
Joined: 15 Jul 2008
Posts: 22
Location: Houston
|
| Posted: Thu Mar 19, 2009 12:33 pm Post subject: |
|
|
| schtevie wrote: | | It would have been nice confirmation to see away teams winning more than 50% of OT games. Maybe it is so, maybe it isn't. |
Since the 86-87 season, home wins OT games 796-741, or at about .518
Home/away may not be the best OT predictor.
Somewhat OT (off-topic, not overtime), but it was always my understanding that the team to force overtime with that last score or stop in regulation was much more likely to win. I have no numbers to back this up, but this would seem to me the best way to predict the winner. |
|
| Back to top |
|
|
Ed Küpfer
Joined: 30 Dec 2004
Posts: 785
Location: Toronto
|
| Posted: Thu Mar 19, 2009 12:55 pm Post subject: |
|
|
Further evidence that I shouldn't trust my eyes to see patterns in the data. I regressed probability of home team win on home and away team win percentages along with home team lead at the half, the latter variable treated as a categorical (factor in R parlance). Here are the regression results, which do show something fishy about -1, but I'm not sure what.
| Code: | coef.est coef.se
a.win.p -0.68 0.02
h.win.p 0.76 0.03
factor(h2)-15 0.17 0.04
factor(h2)-14 0.23 0.04
factor(h2)-13 0.25 0.04
factor(h2)-12 0.28 0.04
factor(h2)-11 0.21 0.03
factor(h2)-10 0.30 0.03
factor(h2)-9 0.31 0.03
factor(h2)-8 0.38 0.03
factor(h2)-7 0.32 0.03
factor(h2)-6 0.38 0.03
factor(h2)-5 0.39 0.03
factor(h2)-4 0.42 0.03
factor(h2)-3 0.46 0.03
factor(h2)-2 0.49 0.03
factor(h2)-1 0.54 0.03 <-- Oy!
factor(h2)0 0.52 0.03
factor(h2)1 0.54 0.03
factor(h2)2 0.56 0.03
factor(h2)3 0.58 0.03
factor(h2)4 0.59 0.03
factor(h2)5 0.65 0.03
factor(h2)6 0.73 0.03
factor(h2)7 0.71 0.03
factor(h2)8 0.74 0.03
factor(h2)9 0.73 0.03
factor(h2)10 0.74 0.03
factor(h2)11 0.77 0.03
factor(h2)12 0.79 0.03
factor(h2)13 0.77 0.03
factor(h2)14 0.78 0.03
factor(h2)15 0.83 0.03
---
n = 10647, k = 33
residual deviance = 1786.7, null deviance = 6268.0 (difference = 4481.3)
overdispersion parameter = 0.2
residual sd is sqrt(overdispersion) = 0.41
|
(I only inlcuded games where the absolute lead was less than 16.)
_________________
ed |
|
| Back to top |
|
|
|

