 |
APBRmetrics
The statistical revolution will not be televised.
|
| View previous topic :: View next topic |
| Author |
Message |
KD
Joined: 30 Jan 2005
Posts: 163
|
|
| Back to top |
|
 |
Eli W
Joined: 01 Feb 2005
Posts: 402
|
 Posted: Mon Apr 11, 2005 10:04 am Post subject: Posted: Mon Apr 11, 2005 10:04 am Post subject: |
 |
|
| Very interesting. Does anyone have a current season ranking of adjusted plus/minus? If Dan's too busy, is it possible to replicate the rankings using data from 82games.com? |
|
| Back to top |
|
|
kjb
Joined: 03 Jan 2005
Posts: 865
Location: Washington, DC
|
| Posted: Mon Apr 11, 2005 10:33 am Post subject: |
|
|
| Unfortunately, NY Times didn't put online Dan's list of the top most underrated and overrated players. Dan, please post when you get a chance. |
|
| Back to top |
|
|
KD
Joined: 30 Jan 2005
Posts: 163
|
| Posted: Mon Apr 11, 2005 11:40 am Post subject: |
|
|
| WizardsKev wrote: | | Unfortunately, NY Times didn't put online Dan's list of the top most underrated and overrated players. Dan, please post when you get a chance. |
 |
|
| Back to top |
|
|
kjb
Joined: 03 Jan 2005
Posts: 865
Location: Washington, DC
|
| Posted: Mon Apr 11, 2005 12:47 pm Post subject: |
|
|
| KD wrote: | | WizardsKev wrote: | | Unfortunately, NY Times didn't put online Dan's list of the top most underrated and overrated players. Dan, please post when you get a chance. |
|
Many thanks. |
|
| Back to top |
|
|
Dan Rosenbaum
Joined: 03 Jan 2005
Posts: 541
Location: Greensboro, North Carolina
|
| Posted: Mon Apr 11, 2005 12:52 pm Post subject: |
|
|
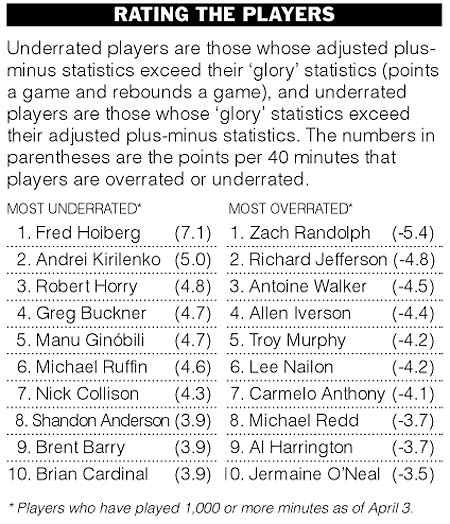
One thing to note about the underrated/overrated list is that it equals:
Adjusted plus/minus rating per 40 minutes
minus
Glory statistics (points plus rebounds plus assists) per game
Note that the glory statistics are normalized to have the same mean and standard deviation as the adjusted plus/minus statistics, so that subtracting one from the other makes sense.
Note that adjusted plus/minus is a per 40 minutes measure and the glory statistics are per game. Thus, the underrated/overated measure is a combination of differences in productivity and in playing time.
This may seem like an apples and oranges comparison, but it appears that salaries are a function of per game measures, whereas productivity I think is best measured per 40 minutes. So I think this is an alright comparison. Overrated/underrated lists are always very difficult to come up with, because it is difficult to come up with how a player is "rated." |
|
| Back to top |
|
|
HoopStudies
Joined: 30 Dec 2004
Posts: 705
Location: Near Philadelphia, PA
|
| Posted: Mon Apr 11, 2005 1:23 pm Post subject: |
|
|
| Dan Rosenbaum wrote: | One thing to note about the underrated/overrated list is that it equals:
Adjusted plus/minus rating per 40 minutes
minus
Glory statistics (points plus rebounds plus assists) per game
Note that the glory statistics are normalized to have the same mean and standard deviation as the adjusted plus/minus statistics, so that subtracting one from the other makes sense.
Note that adjusted plus/minus is a per 40 minutes measure and the glory statistics are per game. Thus, the underrated/overated measure is a combination of differences in productivity and in playing time.
This may seem like an apples and oranges comparison, but it appears that salaries are a function of per game measures, whereas productivity I think is best measured per 40 minutes. So I think this is an alright comparison. Overrated/underrated lists are always very difficult to come up with, because it is difficult to come up with how a player is "rated." |
Makes sense to me. As we've talked about, most underrated and most overrated are the toughest things to come up with because we don't know how a player is "rated".
One thing I wondered was how much error there was in the overrated/underrated estimates... 
_________________
Dean Oliver
Author, Basketball on Paper
The postings are my own & don't necess represent positions, strategies or opinions of employers. |
|
| Back to top |
|
|
kjb
Joined: 03 Jan 2005
Posts: 865
Location: Washington, DC
|
| Posted: Mon Apr 11, 2005 2:17 pm Post subject: |
|
|
Had a pure fan type question that maybe Bob Chaikin could best answer.
What happens if the 10 players on the underrated list play against the 10 players on the overrated list?
What happens if both teams were entered into this year's NBA and played a full schedule? |
|
| Back to top |
|
|
bchaikin
Joined: 27 Jan 2005
Posts: 689
Location: cleveland, ohio
|
| Posted: Tue Apr 12, 2005 12:01 am Post subject: |
|
|
Had a pure fan type question that maybe Bob Chaikin could best answer.
What happens if the 10 players on the underrated list play against the 10 players on the overrated list?
What happens if both teams were entered into this year's NBA and played a full schedule?
give me the minutes per game you want each player to play (in multiples of 4 minutes, i.e. 4, 8, 12, 16, 20, 24, 28, 32, 36, 40 min/g), make sure each team adds up to 240, and i'll run the simulation... |
|
| Back to top |
|
|
gabefarkas
Joined: 31 Dec 2004
Posts: 1313
Location: Durham, NC
|
| Posted: Tue Apr 12, 2005 8:36 am Post subject: |
|
|
| bchaikin wrote: | Had a pure fan type question that maybe Bob Chaikin could best answer.
What happens if the 10 players on the underrated list play against the 10 players on the overrated list?
What happens if both teams were entered into this year's NBA and played a full schedule?
give me the minutes per game you want each player to play (in multiples of 4 minutes, i.e. 4, 8, 12, 16, 20, 24, 28, 32, 36, 40 min/g), make sure each team adds up to 240, and i'll run the simulation... |
here's my shot at it. tough to dole out 240 minutes among 12 people. can i leave certain players totally on the bench?
| Code: | Hoiberg 24 Z Randolph 32
Kirilenko 40 R Jefferson 32
Horry 24 A Walker 24
Buckner 12 Iverson 40
Ginobili 36 Murphy 20
Ruffin 4 Nailon 4
Collison 24 C Anthony 12
Sh Anderson 12 Redd 28
B Barry 36 A Harrington 8
Cardinal 28 J O'Neal 40
240 240
|
|
|
| Back to top |
|
|
gabefarkas
Joined: 31 Dec 2004
Posts: 1313
Location: Durham, NC
|
| Posted: Tue Apr 12, 2005 8:38 am Post subject: |
|
|
| Dan Rosenbaum wrote: | One thing to note about the underrated/overrated list is that it equals:
Adjusted plus/minus rating per 40 minutes
minus
Glory statistics (points plus rebounds plus assists) per game
Note that the glory statistics are normalized to have the same mean and standard deviation as the adjusted plus/minus statistics, so that subtracting one from the other makes sense.
Note that adjusted plus/minus is a per 40 minutes measure and the glory statistics are per game. Thus, the underrated/overated measure is a combination of differences in productivity and in playing time.
This may seem like an apples and oranges comparison, but it appears that salaries are a function of per game measures, whereas productivity I think is best measured per 40 minutes. So I think this is an alright comparison. Overrated/underrated lists are always very difficult to come up with, because it is difficult to come up with how a player is "rated." |
what if you just did the glory stats per 40 min, would that normalize it? |
|
| Back to top |
|
|
kjb
Joined: 03 Jan 2005
Posts: 865
Location: Washington, DC
|
| Posted: Tue Apr 12, 2005 10:22 am Post subject: |
|
|
| gabe's minutes distribution looks fine to me. |
|
| Back to top |
|
|
Dan Rosenbaum
Joined: 03 Jan 2005
Posts: 541
Location: Greensboro, North Carolina
|
| Posted: Tue Apr 12, 2005 10:54 am Post subject: |
|
|
| gabefarkas wrote: | | Dan Rosenbaum wrote: | One thing to note about the underrated/overrated list is that it equals:
Adjusted plus/minus rating per 40 minutes
minus
Glory statistics (points plus rebounds plus assists) per game
Note that the glory statistics are normalized to have the same mean and standard deviation as the adjusted plus/minus statistics, so that subtracting one from the other makes sense.
Note that adjusted plus/minus is a per 40 minutes measure and the glory statistics are per game. Thus, the underrated/overated measure is a combination of differences in productivity and in playing time.
This may seem like an apples and oranges comparison, but it appears that salaries are a function of per game measures, whereas productivity I think is best measured per 40 minutes. So I think this is an alright comparison. Overrated/underrated lists are always very difficult to come up with, because it is difficult to come up with how a player is "rated." |
what if you just did the glory stats per 40 min, would that normalize it? |
No, it would not. Even measured per 40 minutes, glory statistics are on a different scale than adjusted plus/minus statistics. The best way to make them comparable (so that I can take the difference between them) is to "normalize" them to have the same mean and standard deviation. So I normalized the glory statistics to have a mean of zero (the adjusted plus/minus statistics already have a mean of zero) and a standard deviation equal to that of the adjusted plus/minus statistics. |
|
| Back to top |
|
|
gabefarkas
Joined: 31 Dec 2004
Posts: 1313
Location: Durham, NC
|
| Posted: Tue Apr 12, 2005 11:32 am Post subject: |
|
|
gotcha. i'm guessing that you did the sum of Pts+Rbs+Ast and then normalized?
also, i'm guessing that taking Glory/game vs Glory/40 wouldn't affect the outcome, since one is basically a ratio of the other? |
|
| Back to top |
|
|
bchaikin
Joined: 27 Jan 2005
Posts: 689
Location: cleveland, ohio
|
| Posted: Tue Apr 12, 2005 1:45 pm Post subject: |
|
|
here's the simulation for dan's most underrated versus overrated players, each team playing 8200 games versus an equal number of games (or close to equal) against the other NBA teams:
underated players
W 61 L 21 per average 82 games
min def
24 +2.0% n.collison (24 C) 9 pts/g
40 -5.0% a.kirilenko (28 PF, 12 SF) 21 pts/g, 317 BS, 347 ast
24 -3.0% r.horry (16 C, 8 PF) 9 pts/g
36 -4.0% m.ginobili (8 SF, 16 SG, 12 PG) 22 pts/g, 440 ast
36 -2.0% b.barry (36 PG) 14 pts/g, 333 ast
4 +1.5% m.ruffin (4 C) 1 pt/g
28 -0.5% b.cardinal (4 C, 12 PF, 12 SF) 12 pts/g, 211 ast
12 +2.0% g.buckner (12 SF) 4 pts/g
24 -1.5% f.hoiberg (24 SG) 10 pts/g
12 -2.5% sh.anderson (4 SF, 8 SG) 4 pts/g
as you can see having kirilenko for 40 min/g makes a huge difference...
off FG% - .459
def FG% - .408
stat/team/opp
ST 10.0/7.5
TO 13.6/16.0
FTM 28/20
FTA 20/26
reb 42/41
ast 23/20
BS 7.4/4.6
overrated players
W 44 L 38 per average 82 games
min def
40 -4.0% j.o'neal (40 C) 18 pts/g, 184 BS
32 +2.5% z.randolph (32 PF) 12 pts/g
32 -2.5% r.jefferson (24 SF, 8 SG, 4 PG) 11 pts/g
28 +2.5% m.redd (24 SG, 4 PG) 10 pts/g
40 -3.0% a.iverson (40 PG) 20 pts/g, 460 ast
20 +3.0% t.murphy (8 C, 12 PF) 7 pts/g
24 +3.5% a.walker (4 PF, 20 SF) 8 pts/g
8 +4.5% a.harrington (4 SF, 4 SG) 3 pts/g
12 +2.5% c.anthony (12 SG) 5 pts/g
4 +2.5% l.nailon (4 SG) 1 pt/g
i had to play some players out of position, like c.anthony at SG, and jefferson and redd at PG for short stretches...
off FG% - .430
def FG% - .448
stat/team/opp
ftm 25/15
fta 32/20
reb 44/41
ast 15/22
st 7/6
to 12.8/13.3
bs 4.1/4.8 |
|
| Back to top |
|
|
|
|
You cannot post new topics in this forum
You cannot reply to topics in this forum
You cannot edit your posts in this forum
You cannot delete your posts in this forum
You cannot vote in polls in this forum
|
Powered by phpBB © 2001, 2005 phpBB Group
|

